Your Ticket Volume Went Down. That Is Not Automatically Good News.
A falling ticket count tells you how many problems were logged, not how many happened. Reporting systems undercount badly: Britain's safety regulator estimates only about half of legally reportable workplace injuries are reported. Four causes produce the same falling chart. Ask for unique requesters, reopen rate and the incident-to-request split before calling it good news.
- A ticket count is demand, not outcome. It equals the problems that happened, times the share somebody reported, times the share that got logged.
- Four causes make the same falling line. Fewer faults, fewer reports, closures without a fix, and work that moved to an unlogged channel.
- Every service desk metric shares one denominator, the tickets that exist. None can see a problem that was never logged.
- Unique requesters as a share of headcount is the cheapest test. If volume and requesters fell together, reporting fell and demand did not.
- Once volume reduction becomes a target, the count becomes an output to manage. Reclassifying tickets is cheaper than engineering out a fault.
What does a falling ticket count actually tell you?
A falling ticket count tells you one thing. Fewer tickets were logged this month than last. It does not tell you that fewer things broke.
Logged tickets equal the problems that happened, times the share somebody reported, times the share that reached the ticket system. You pay a provider to shrink the first factor. The other two are human behaviour and move on their own.
Government statisticians treat reported counts this way as routine. The Office for National Statistics warns that in police recorded crime, trends can be affected by changes in how crimes are recorded, police activity, and public reporting. It runs a household survey beside the police figures because that survey includes crimes not reported to, or recorded by, the police.
Your monthly help desk report is the police figure. Nobody runs the survey.
A national statistic just fell, and nobody can say why
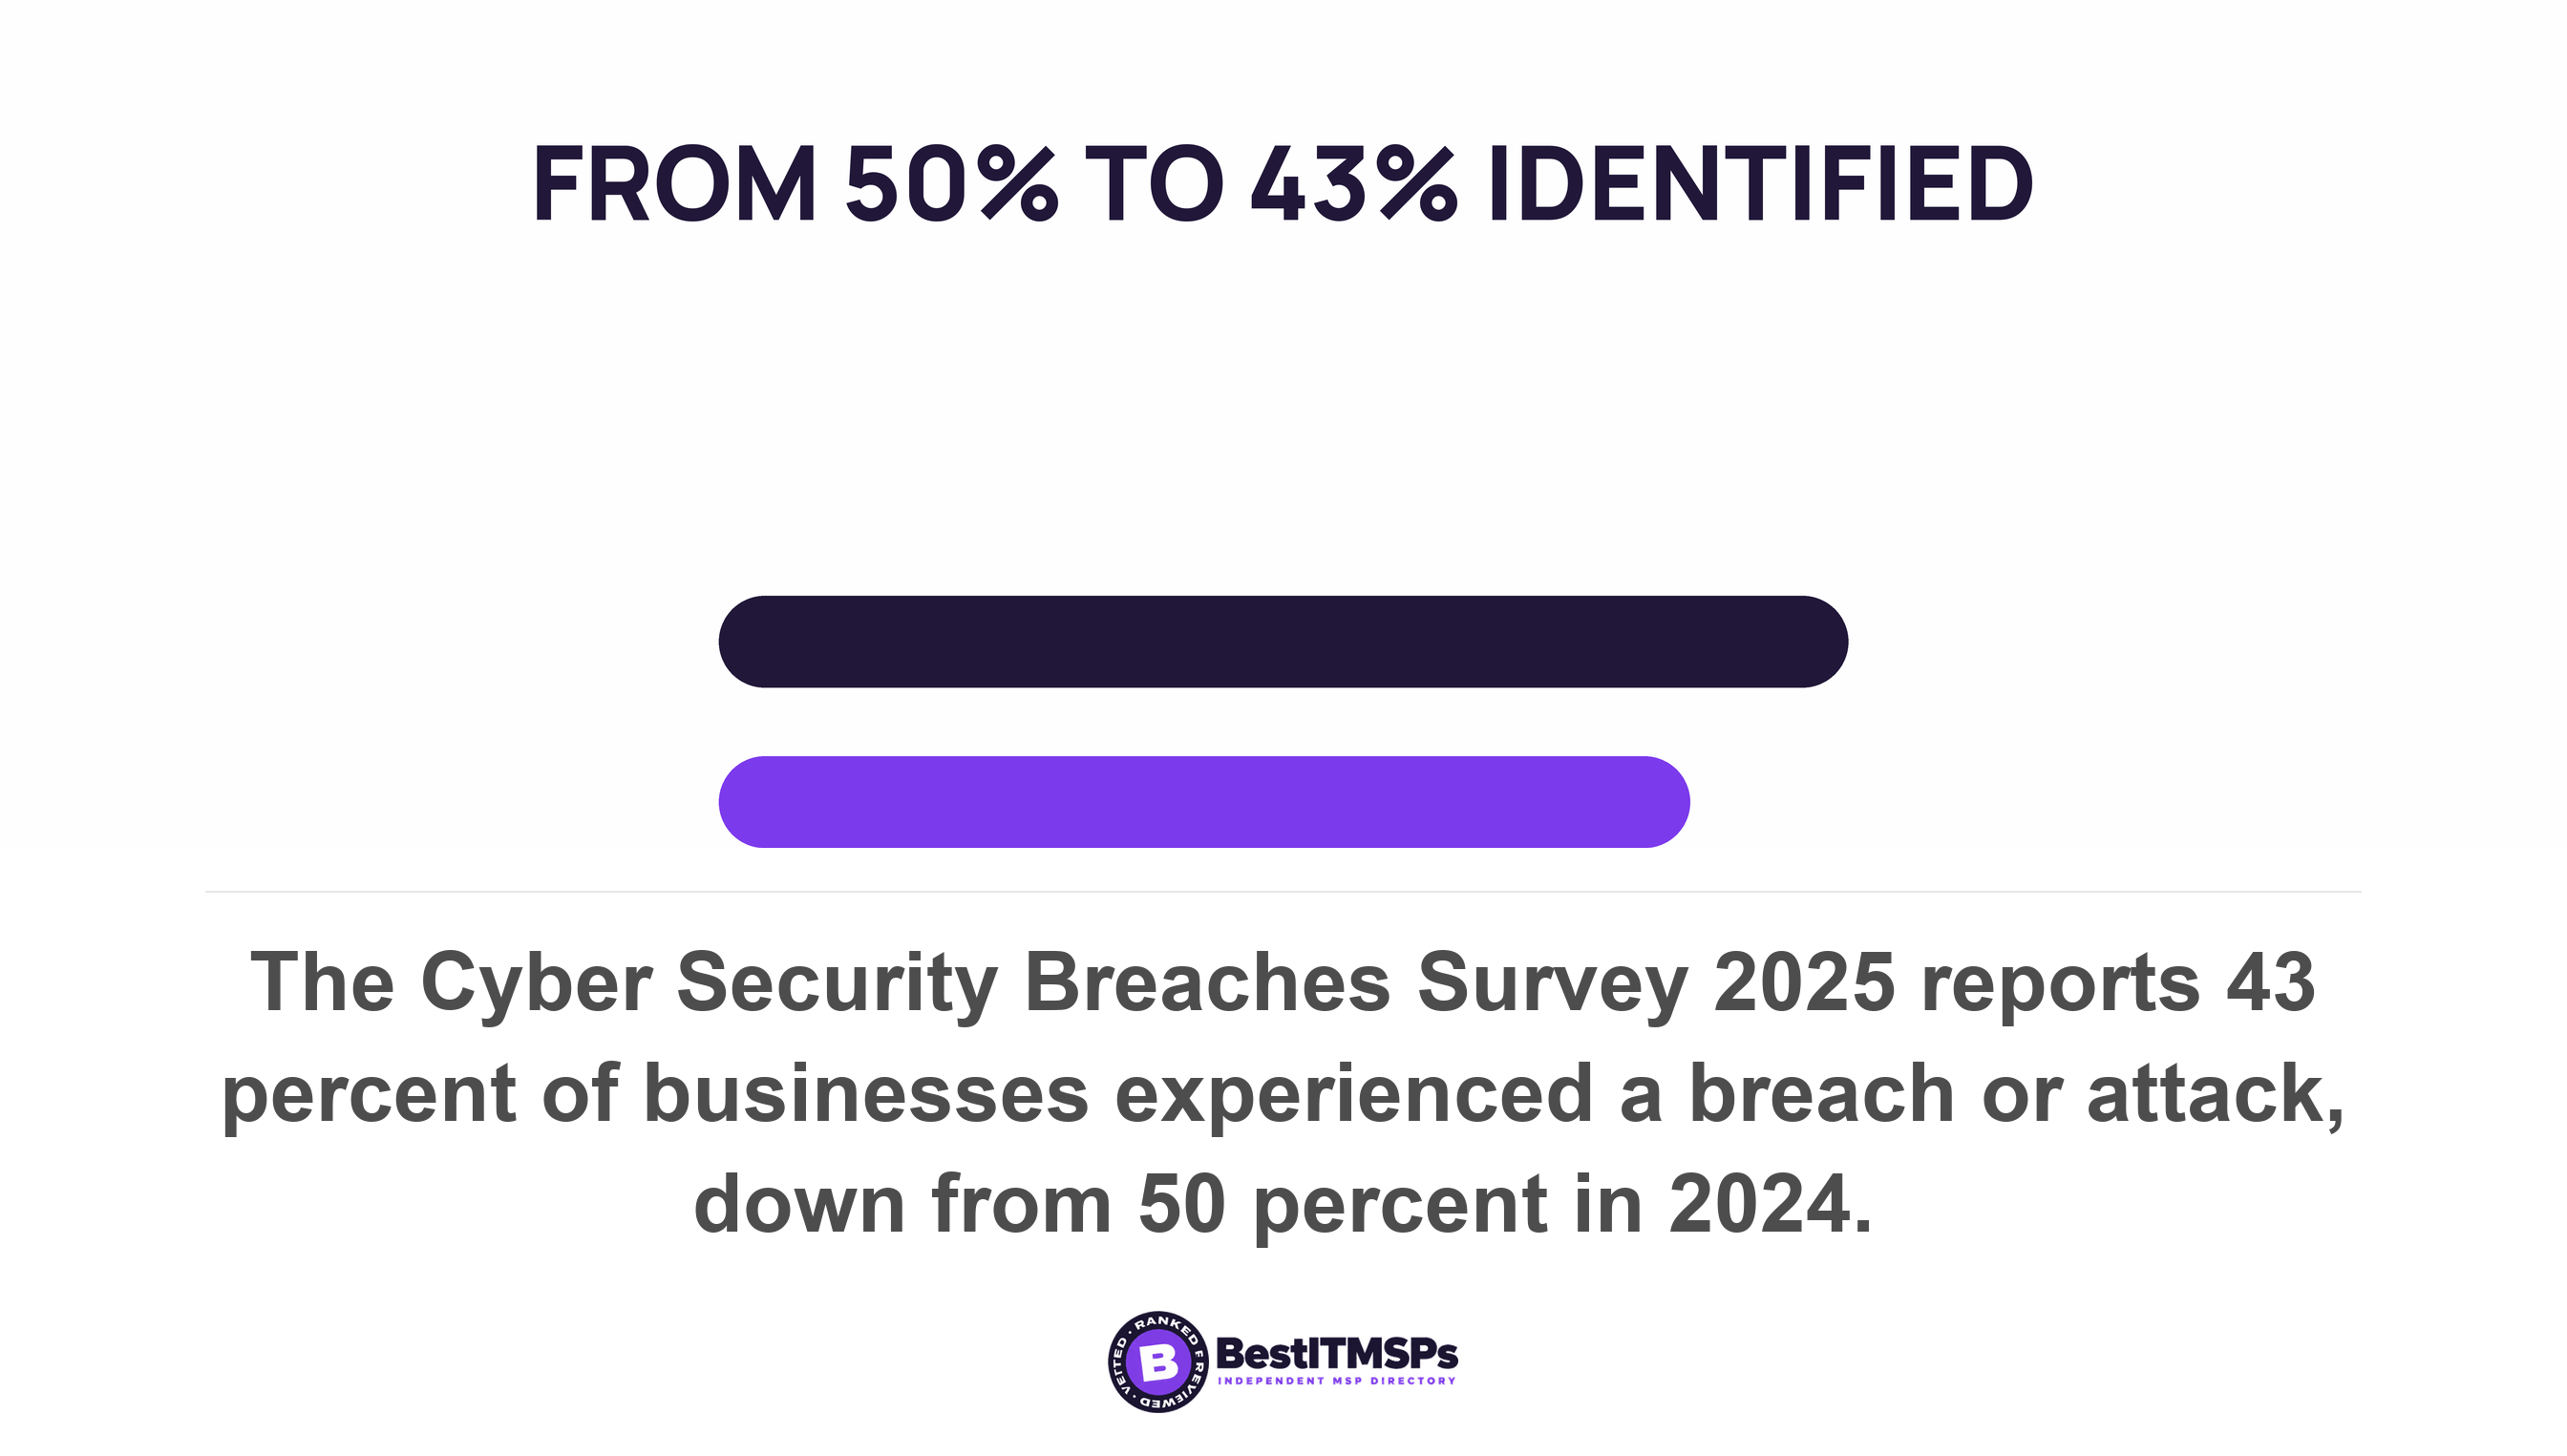
The clearest example is a government number, not a help desk one. The UK Cyber Security Breaches Survey reports 43 percent of businesses experienced a cyber breach or attack in the last 12 months, down from 50 percent a year earlier.
Then read the explanation. The survey says the decrease was primarily driven by fewer micro and small businesses identifying phishing attacks. The verb is identifying, not experiencing. A statistics team with a published method will not claim it knows which one moved. Your provider's chart claims it anyway. The survey is willing to say the quiet part elsewhere: explaining why smaller firms report fewer breaches than large ones, it notes the findings may indicate poorer identification and reporting practices in smaller organisations as they may have less sophisticated cyber security monitoring in place. A lower number can be a thinner net.
Four reasons a ticket count goes down
Four causes produce the same falling line, and only one is good news.
- Fewer faults. Proactive work removed a recurring problem at its root cause.
- Fewer reports. Staff stopped raising tickets. Every problem is still there, now silent.
- Earlier closures. Tickets close before the fault is fixed, so the user gives up next week.
- A different channel. Work moved to chat, a direct call, or somebody in your office who quietly fixes things.
Three of the four look identical on a graph. Each has one number that separates it, and none of those numbers is the ticket count.
Why staff stop reporting IT problems
Staff stop reporting when a ticket costs more effort than the workaround. Four minutes to raise and three days to resolve teaches a lesson, and the lesson is to stop raising tickets.
Google's engineering handbook names the mechanism. Where blame follows a report, people will not bring issues to light for fear of punishment, and an atmosphere of blame risks creating a culture in which incidents and issues are swept under the rug. Removing blame, it says, gives people the confidence to escalate issues without fear.
The size of that effect is measurable where reporting is a legal duty. Britain's Health and Safety Executive states that employers substantially under-report these non-fatal injuries and puts overall employer reporting of RIDDOR-defined non-fatal injuries to employees at around a half. A duty written into law, with an inspectorate and penalties behind it, captures about half of what it covers. An IT ticket carries none of those.
Can first contact resolution or reopen rate catch an unreported problem?
No. Every standard service desk metric is calculated over the tickets that exist, so none can see a problem that was never logged.
First contact resolution is the share of logged tickets closed on first touch. Reopen rate is the share of closed tickets that come back. Resolution time measures logged tickets. Ticket backlog counts logged tickets still open. Satisfaction scores survey the people whose logged ticket got closed. Five measures, one shared denominator.
No set of numbers drawn from one pool tells you how large the pool should have been. So the useful question is not which ticket metric is best. It is which number here has a denominator my provider does not control. The UK government's own service rule makes that move, defining completion rate as the number of digital transactions that your users complete as a percentage of all digital transactions and counting a failed transaction as when a user gives up before reaching a defined end page.
Three numbers whose denominator your provider does not control
Three numbers use a denominator your provider does not own. Your headcount, your device count and your sites. Ask for each as a monthly series across 12 months.
Unique requesters as a share of headcount
Count the distinct people who raised at least one ticket, then divide by headcount. If volume fell 30 percent and unique requesters fell 30 percent too, demand did not fall. Reporting did. If volume fell while unique requesters held flat, each person is raising fewer problems, which is the good case. Almost no monthly report carries this line.
Requester concentration
Take the share of tickets raised by your top three requesters. A high and rising share means you run an unofficial first line inside your own business. Somebody absorbs the small faults and only escalates what defeats them. That person is unpaid and unlogged, and when they leave your ticket volume jumps.
Tickets per device and per site
Monitor the ratio rather than the raw total. Close an office or lose 15 staff and volume falls for reasons unrelated to service quality. Your asset register is the denominator, and the IT asset register you can demand from your MSP today sets out its fields.
Closure is not resolution
A ticket closes when somebody presses a button. A fault ends when the user stops hitting it. A volume chart records only the first.
Three numbers expose the gap. What share of closed tickets are reopened inside 7 days and inside 30 days. What share of closures carry administrative codes such as no fault found, duplicate, merged or user cancelled. How many repeat tickets hit the same user or device inside a month. A rising administrative share beside a falling volume is a count being managed, not a fault being fixed. For what your agreement promises on the clock, read First Response or Resolution: Which SLA You Should Actually Care About.
What happens when ticket volume becomes a target
A measure used as a target stops measuring. That is Goodhart's law, and it is why a ticket count printed on an invoice is worth less than the same count printed nowhere.
CNA, a United States research institute, states the law as when a measure becomes a target, it ceases to be a good measure. Where a measure carries a reward, we provide an incentive to manipulate the measure in order to receive the reward, producing actions that actually reduce the effectiveness of the measured system. Attribute that sentence correctly, because almost nobody does. It is not Goodhart's wording. It comes from the anthropologist Marilyn Strathern, writing about university audit in the European Review in 1997.
For your provider the consequence is arithmetic. Engineering a recurring fault out of your network is slow and expensive. Merging tickets, reclassifying an incident as a service request, closing early and shifting routine work to self-service are cheap and fast. Every one moves the count. Never put volume reduction in a bonus clause without a second number beside it that paperwork cannot move.
Incidents and requests counted together hide the trend
An incident is something broken. A service request is something somebody wants. In one total, the number moves for reasons unrelated to reliability. Hire 12 people and you generate requests and no incidents, so a quiet hiring month reads as a quieter network.
Ask for the two counted separately, with the written rule used to sort them. An accurate count needs a published definition, and no free standard supplies one. The definitions sit in ITIL and in ISO/IEC 20000-1, both sold rather than published, so every provider writes its own and no two counts compare. Service Desk Best Practices covers why the split matters day to day.
Work that moved somewhere you cannot see
Work leaves the ticket system whenever an easier channel exists. A chat message to a friendly engineer, a call to a mobile number, or a workaround passed between two desks all solve the problem and log nothing.
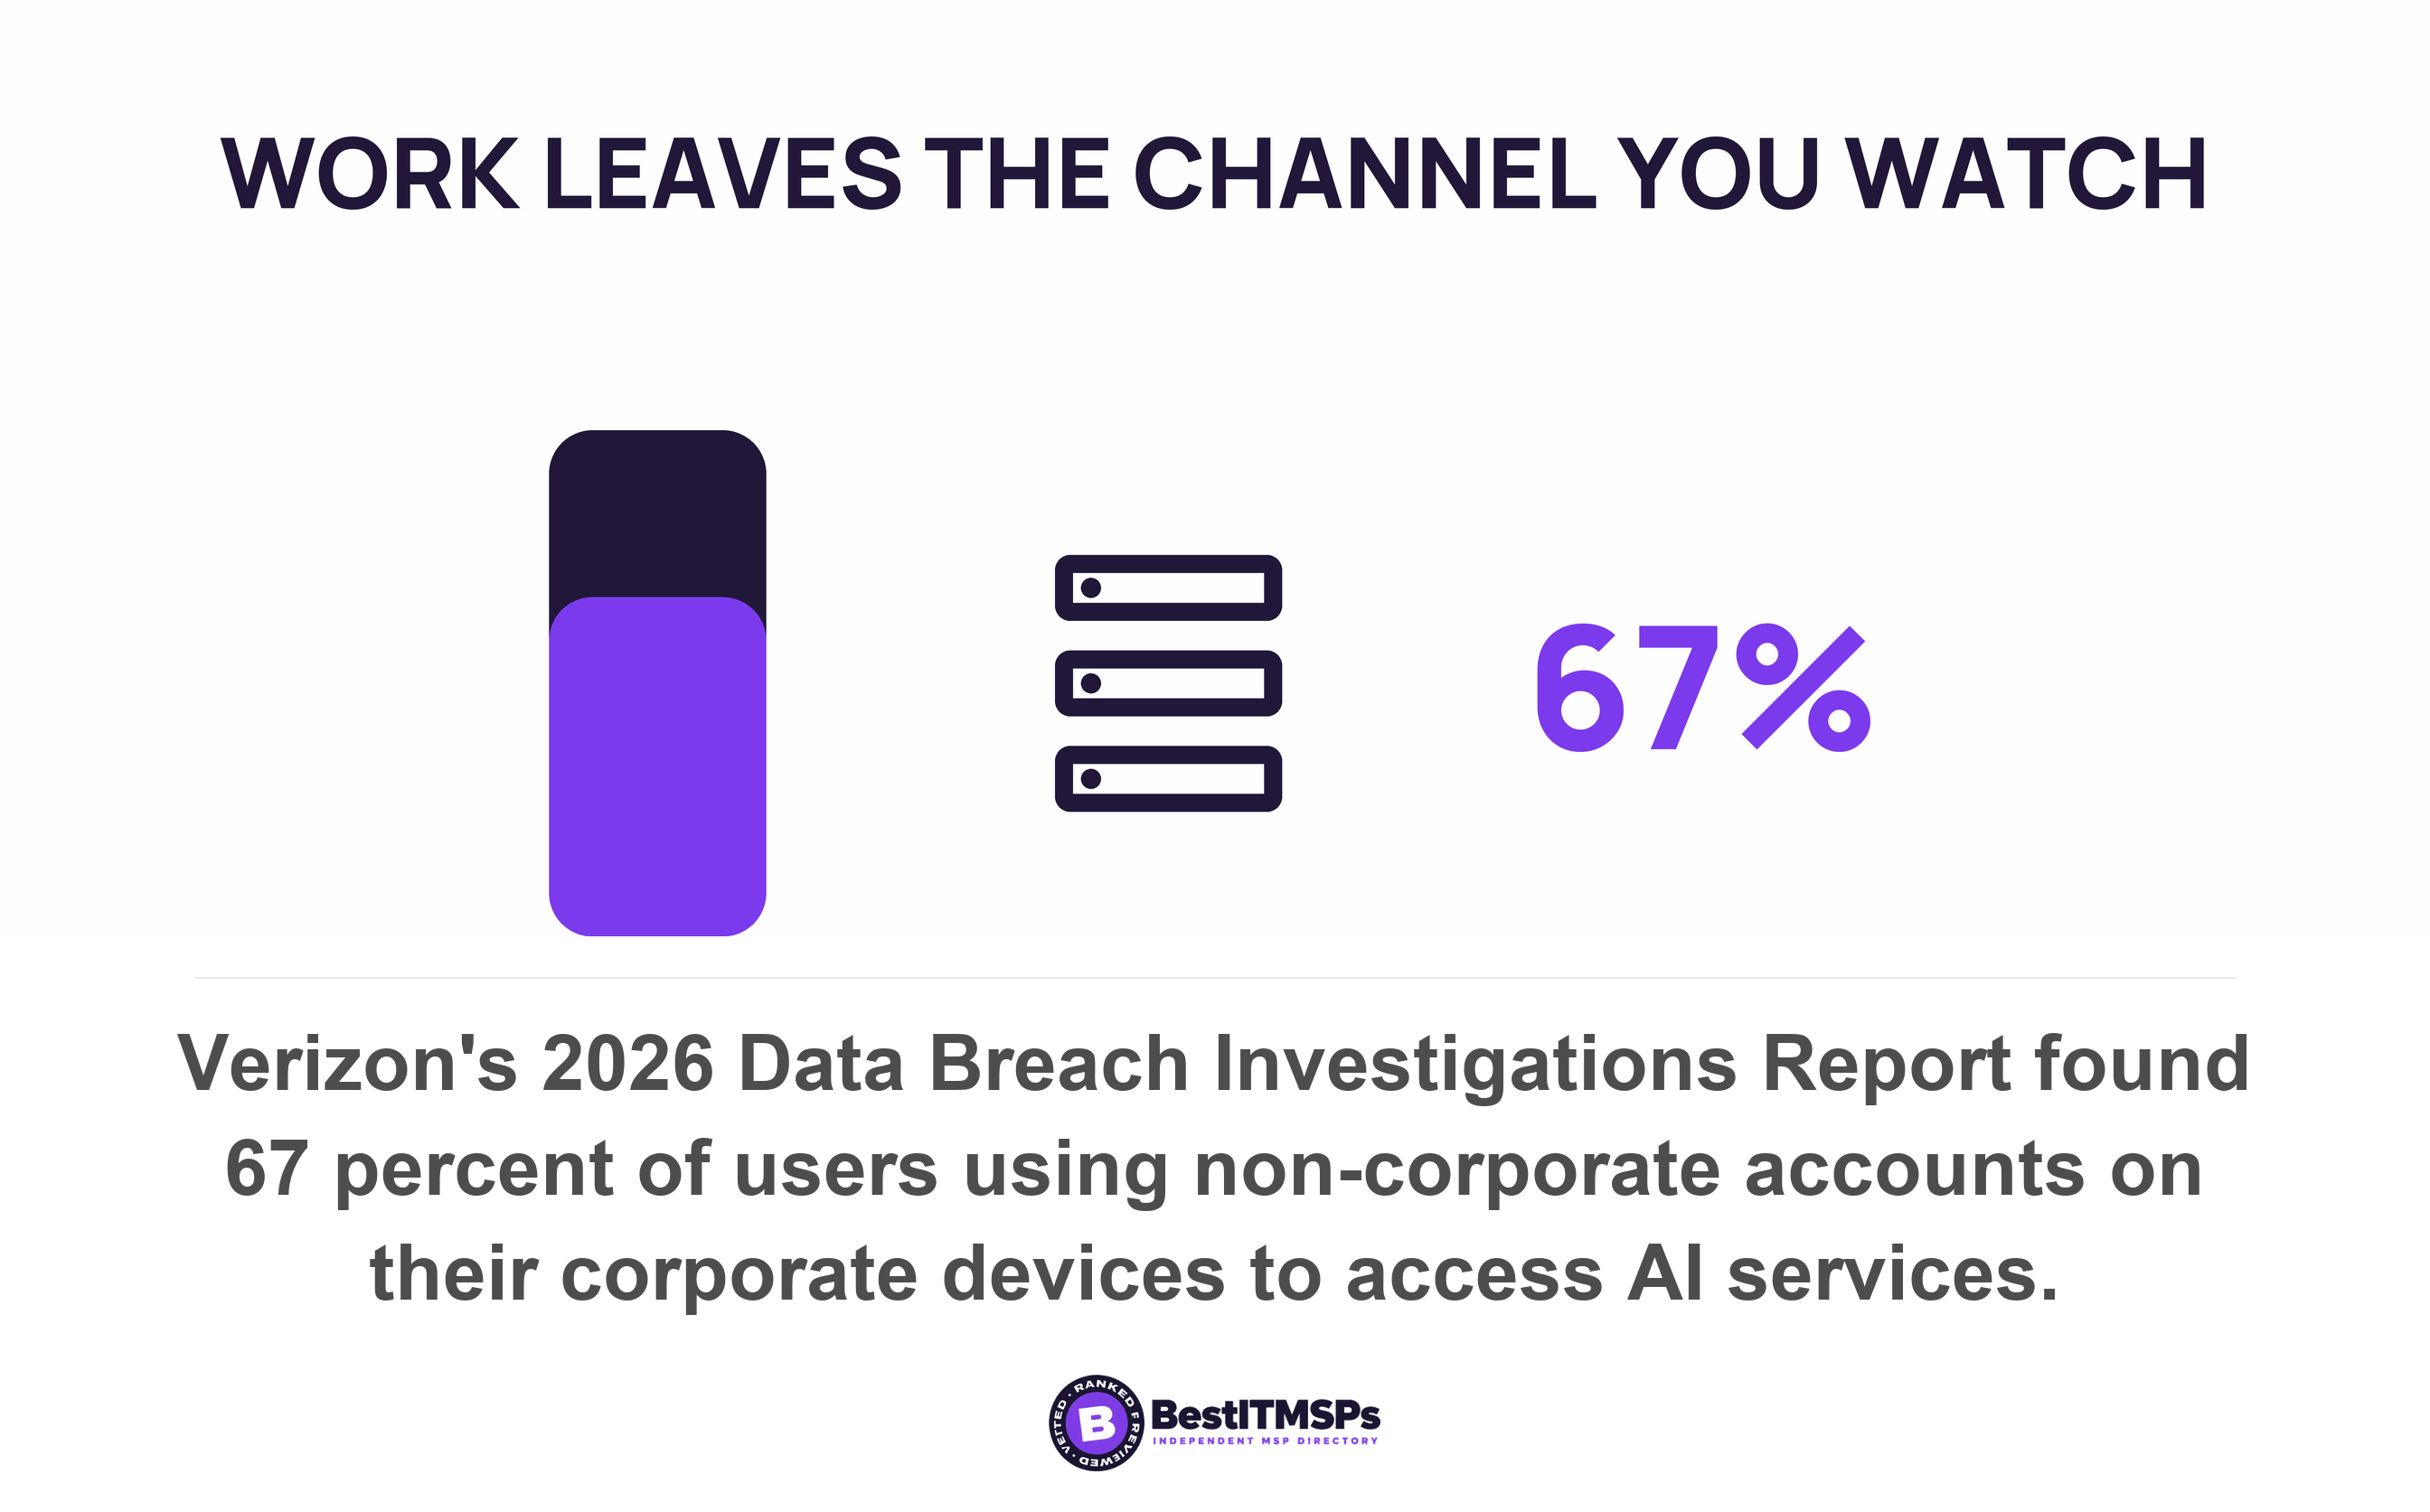
The scale of that drift is measurable in a neighbouring behaviour. Verizon's 2026 Data Breach Investigations Report found 45 percent of employees are now considered regular users of AI, authorized or not, on their corporate devices, up from 15 percent in the previous year, and reports separately that 67 percent of users are using non-corporate accounts on their corporate devices to access AI services, a figure it calls a slight decrease on the year before. Those are two independent measurements rather than a share of one another, and both describe work happening on company hardware through a channel nobody is counting. Ask for ticket count by source, meaning portal, email, telephone and chat. A channel whose share collapses while total volume falls is work going dark, not work going away.
What to ask your provider this week
To make a falling ticket count mean something, send five requests before the next review.
- Ask for unique requesters per month across 12 months, beside your own headcount.
- Ask for the share of tickets raised by your top three requesters.
- Ask for incidents and service requests as two series, with the rule used to classify them.
- Ask what share of closures are reopened inside 7 and 30 days, and what share were coded no fault found or duplicate.
- Ask for ticket count by source channel, so work moving to chat becomes visible.
Then do what the statisticians do and run your own survey. The Health and Safety Executive does not rely on employer reports alone. Its household survey found 680,000 workers sustained a non-fatal injury at work in 2024/25, against the 59,219 their employers filed under a narrower legal test. The two are not like for like, and that is the point. Yours costs one question a quarter. In the last month, did you have an IT problem you did not raise a ticket for?
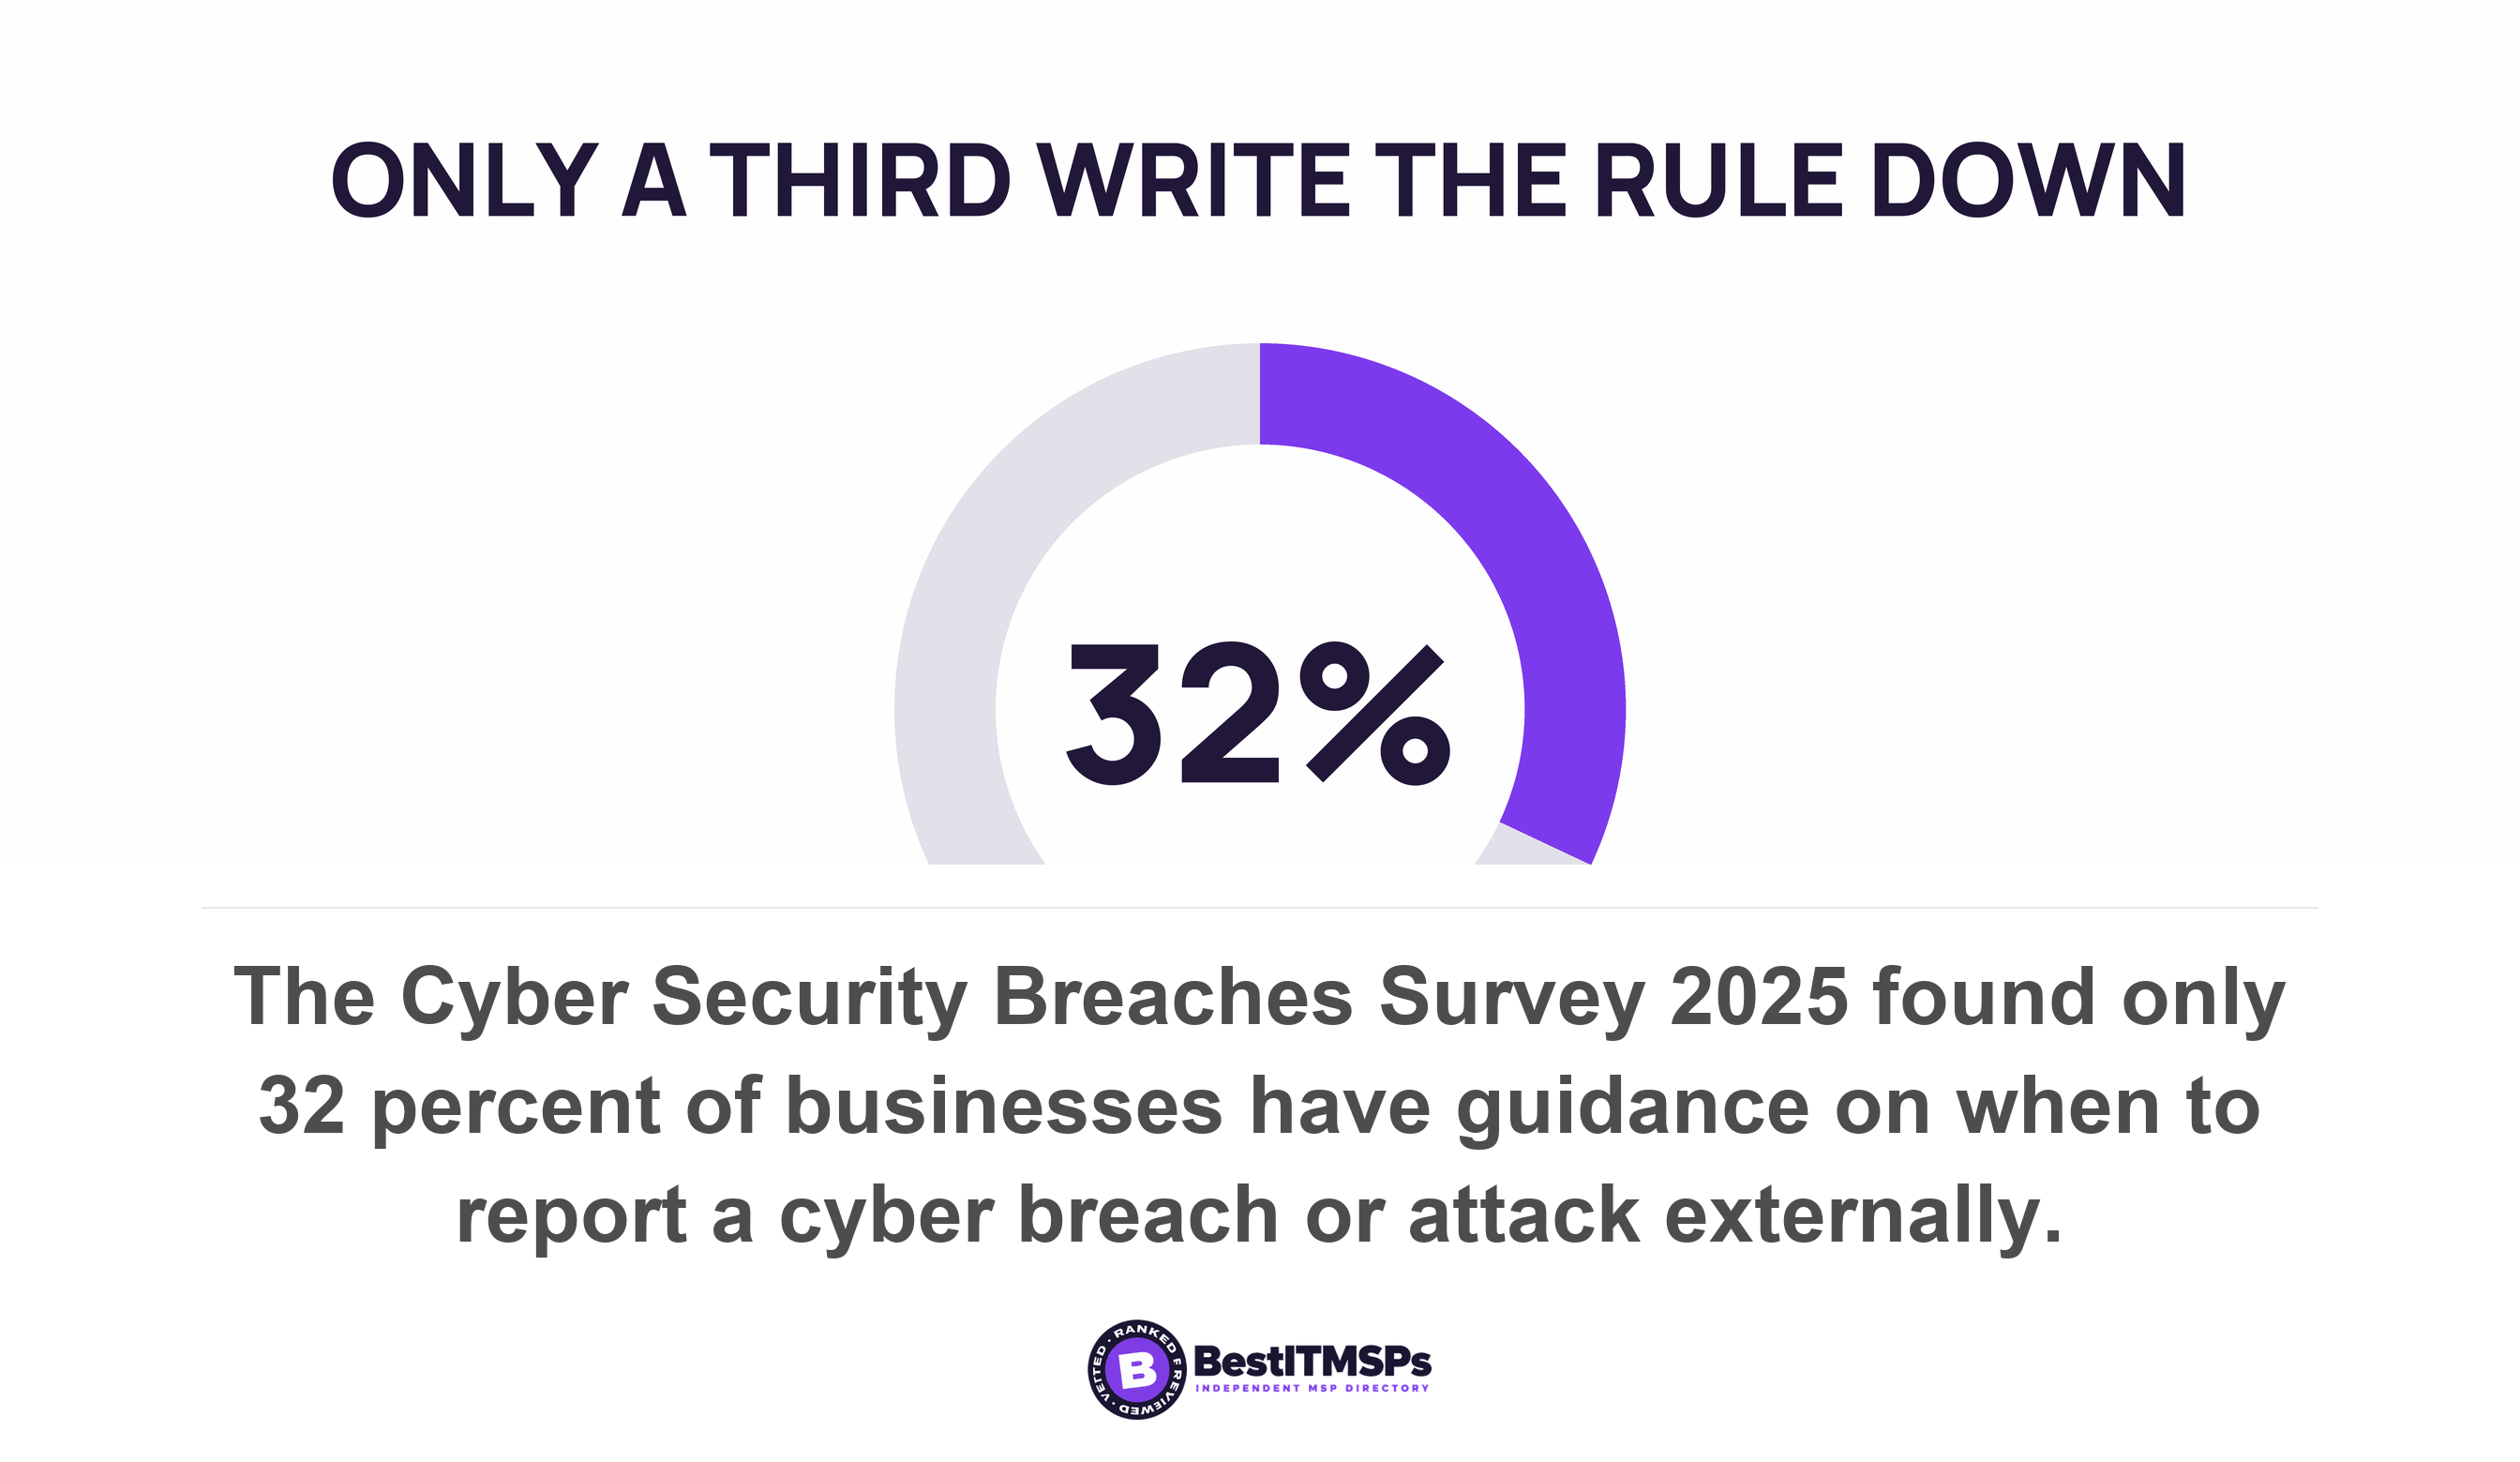
Most businesses have never written a reporting rule down. The same survey found only 32 percent of businesses have guidance on when to report a cyber breach or attack externally, and that is the high-stakes case. Put the rule in the service level agreement, then compare what three providers offer.
FAQ
Is a falling ticket count a good sign?
Not on its own. A count falls for four reasons and only one is good. Compare it against unique requesters as a share of headcount. If both fell together, reporting fell rather than demand. Britain's safety regulator puts employer reporting of RIDDOR-defined non-fatal injuries at around a half.
What is a unique requester count, and why does it matter?
A unique requester count is the number of distinct people who raised at least one ticket in a month. It matters because its denominator is your headcount, which your provider does not control. Every other help desk metric is calculated over logged tickets, so none can see a problem nobody logged.
Why would staff stop reporting IT problems?
Staff stop reporting when a ticket costs more effort than a workaround, and blame speeds that up. Google's engineering handbook states that people will not bring issues to light for fear of punishment and that an atmosphere of blame risks creating a culture in which incidents and issues are swept under the rug.
Should ticket volume reduction be a target in an MSP contract?
Not by itself. CNA states Goodhart's law as when a measure becomes a target, it ceases to be a good measure, because a reward provides an incentive to manipulate the measure. Pair any volume target with reopen rate, unique requesters and the incident-to-request split, reported monthly.
What should you ask your provider when ticket volume drops?
Ask for three numbers beside the count. Unique requesters as a share of headcount, so a fall in reporting shows up against a denominator your provider does not control. Ticket count by source, because a channel whose share collapses is work moving somewhere nobody logs. And the reopen rate, because a count falls just as neatly when tickets are closed without a fix. If all three hold steady while volume falls, the fall is real.
Best IT MSP is the independent directory of managed IT and cybersecurity providers across the US and Canada. We rank on verified rating and firmographic data, we label paid placement, and we do not sell IT services. Ask three ranked providers in your city for unique requesters and reopen rate, then compare what comes back.