What 24,491 provider records say about MSP star ratings
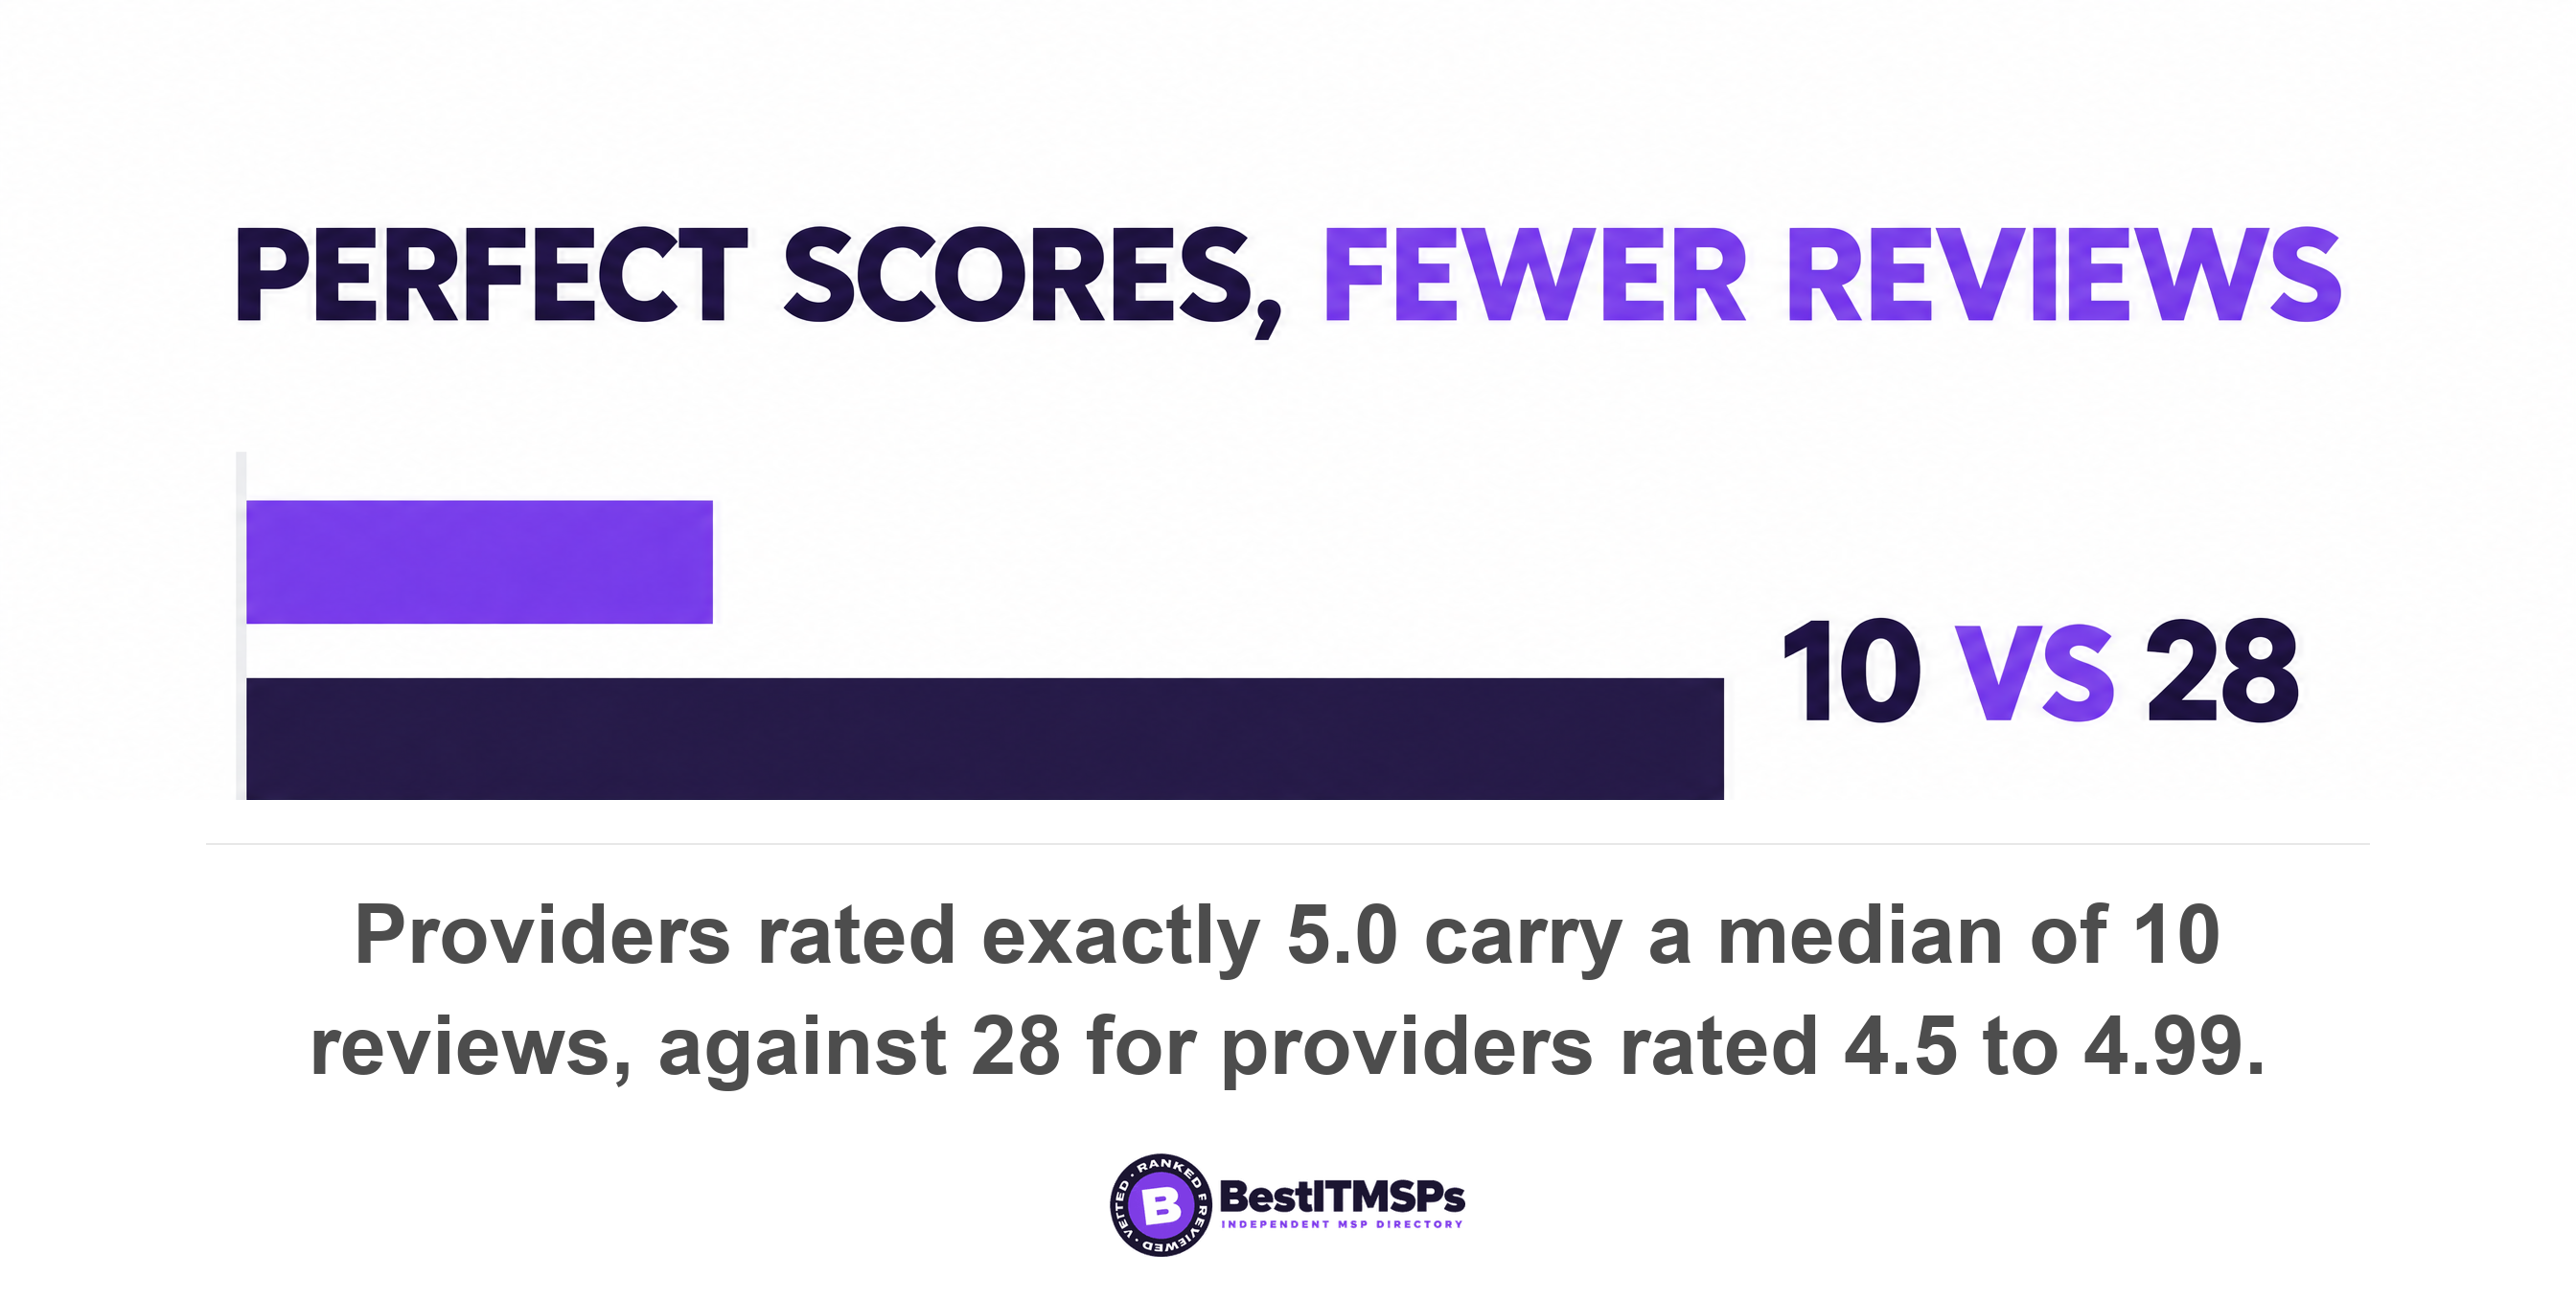
A five-star rating is the most common rating in the managed IT market, not a distinction. Across 24,491 provider records in 730 city datasets, 61.8 percent of rated providers sit at exactly 5.0, and those firms carry a median of 10 reviews against 28 for firms rated 4.5 to 4.99.
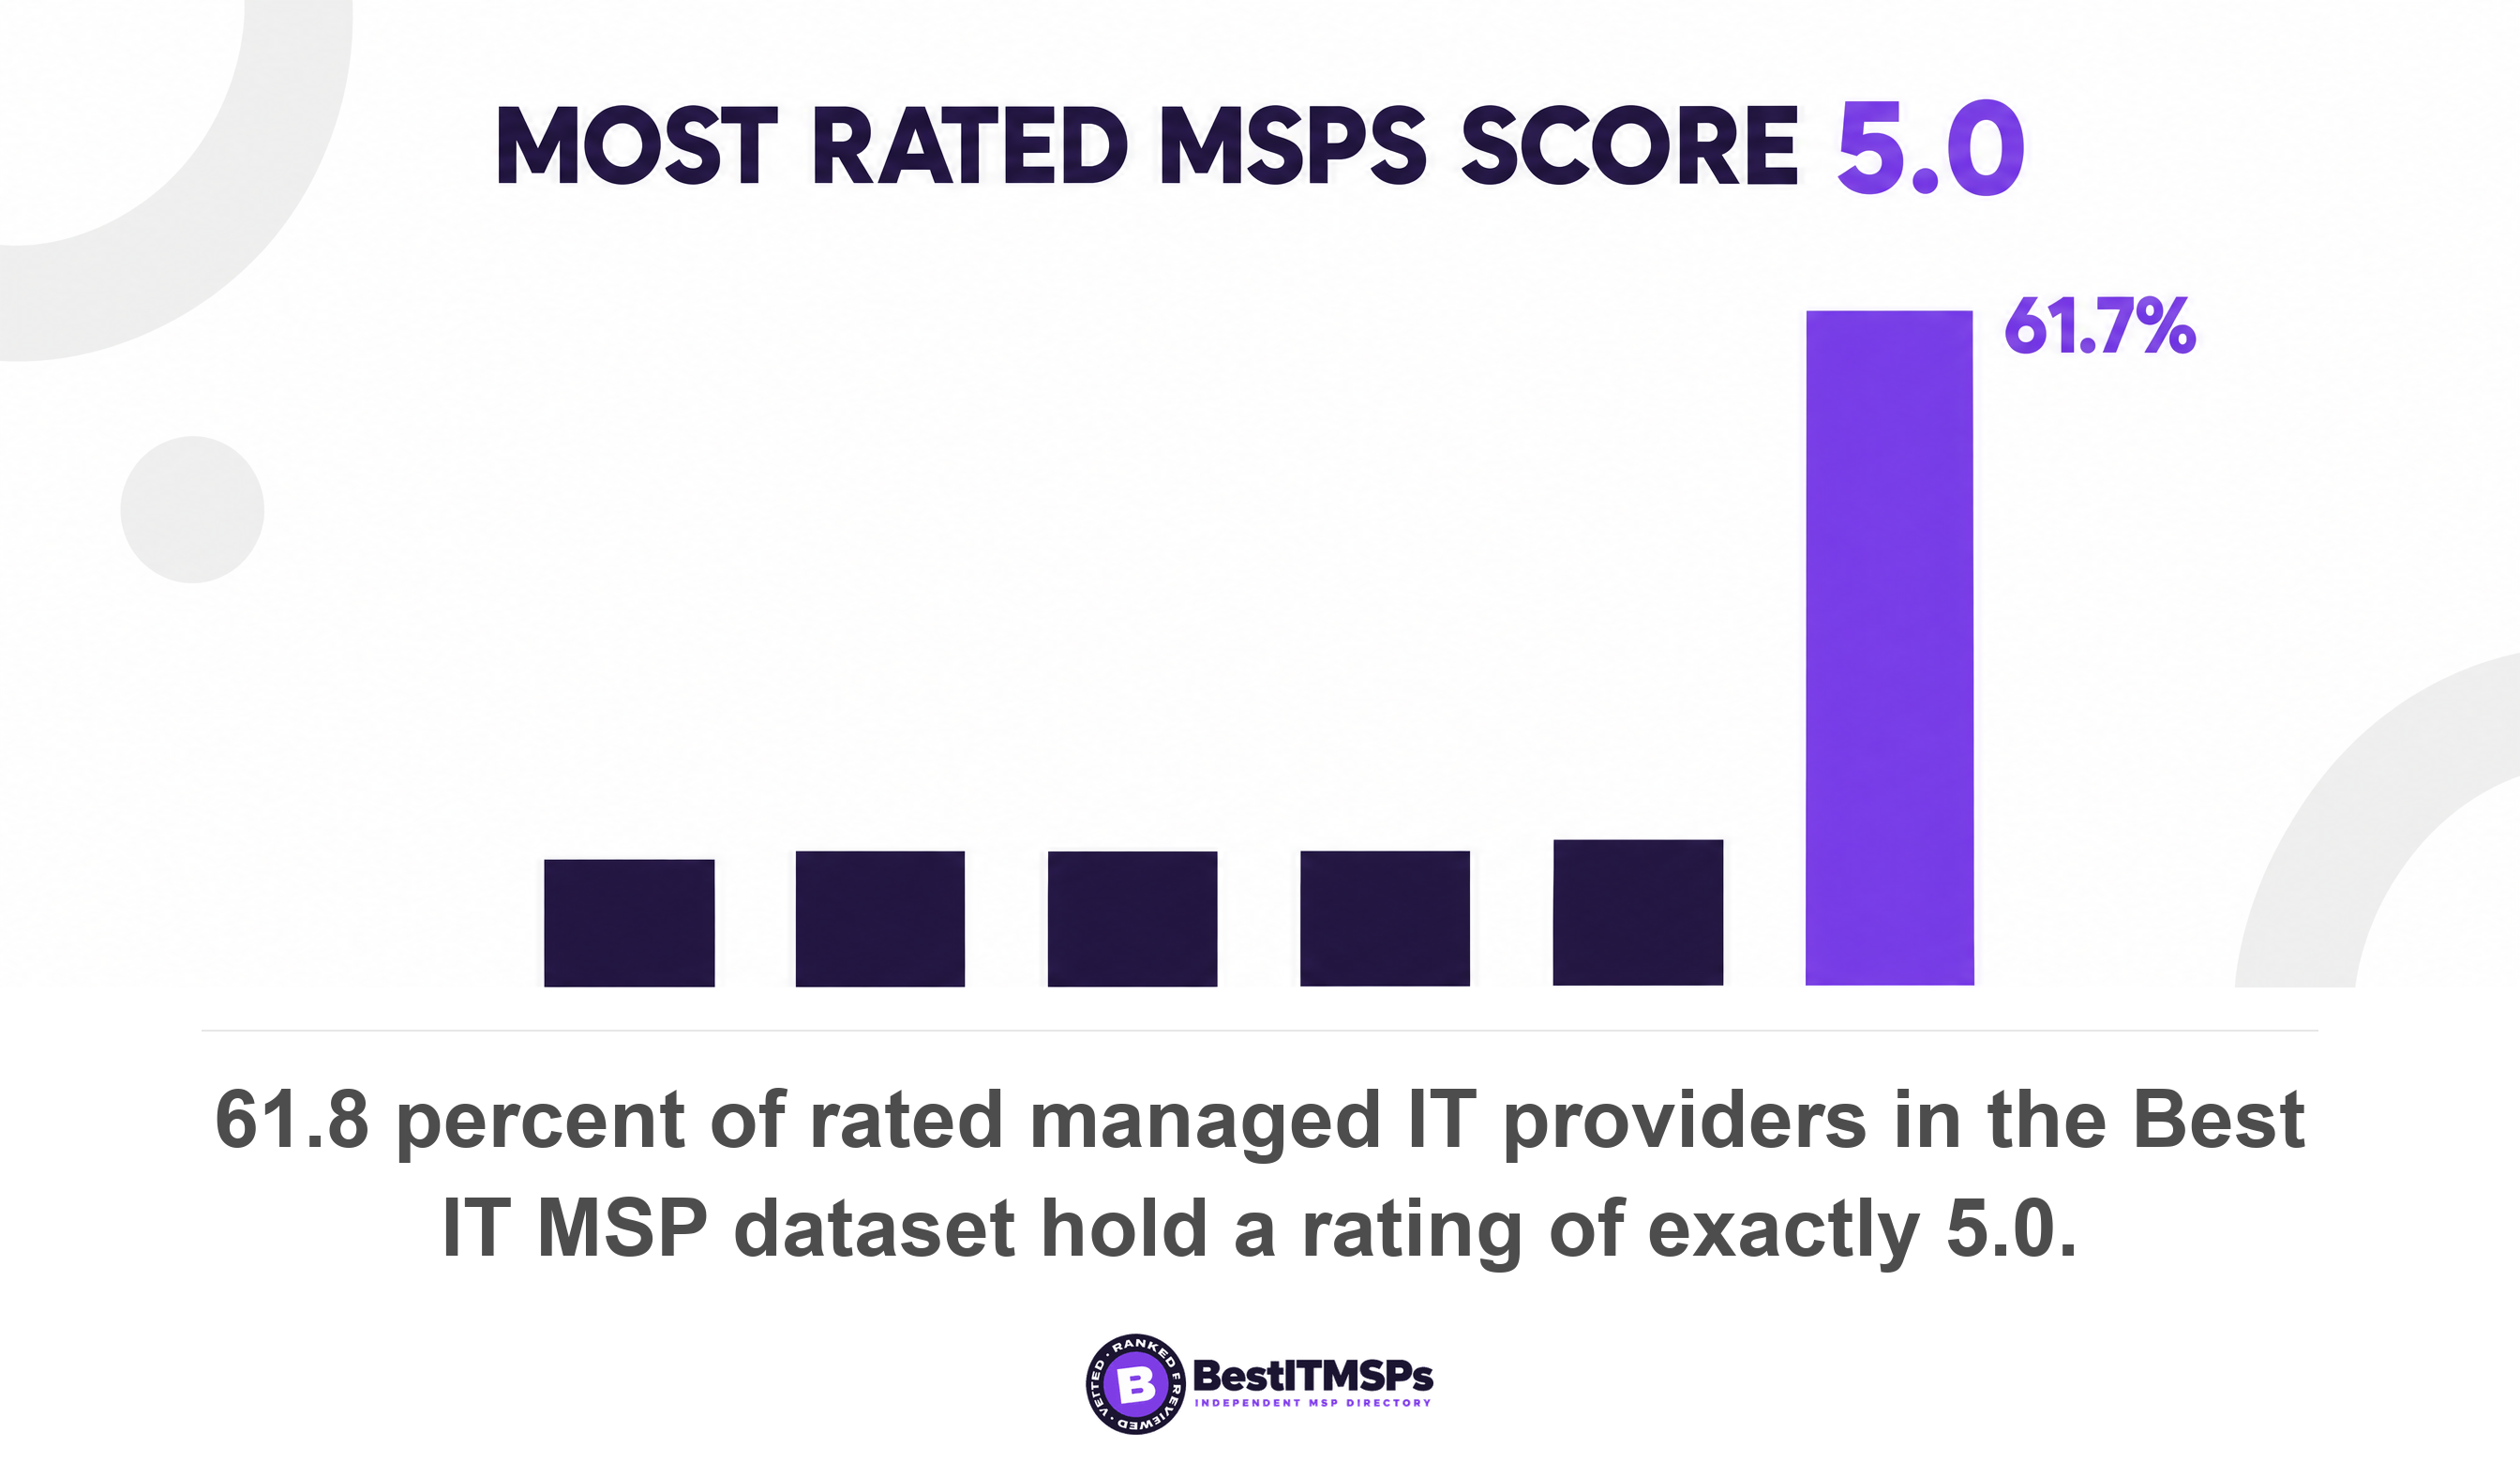
- A 5.0 is the most common rating in the market, not a differentiator. In our dataset, 61.8 percent of rated providers sit at exactly 5.0.
- The perfect scores carry fewer reviews. Firms rated 5.0 hold a median of 10 reviews, while firms rated 4.5 to 4.99 hold 28.
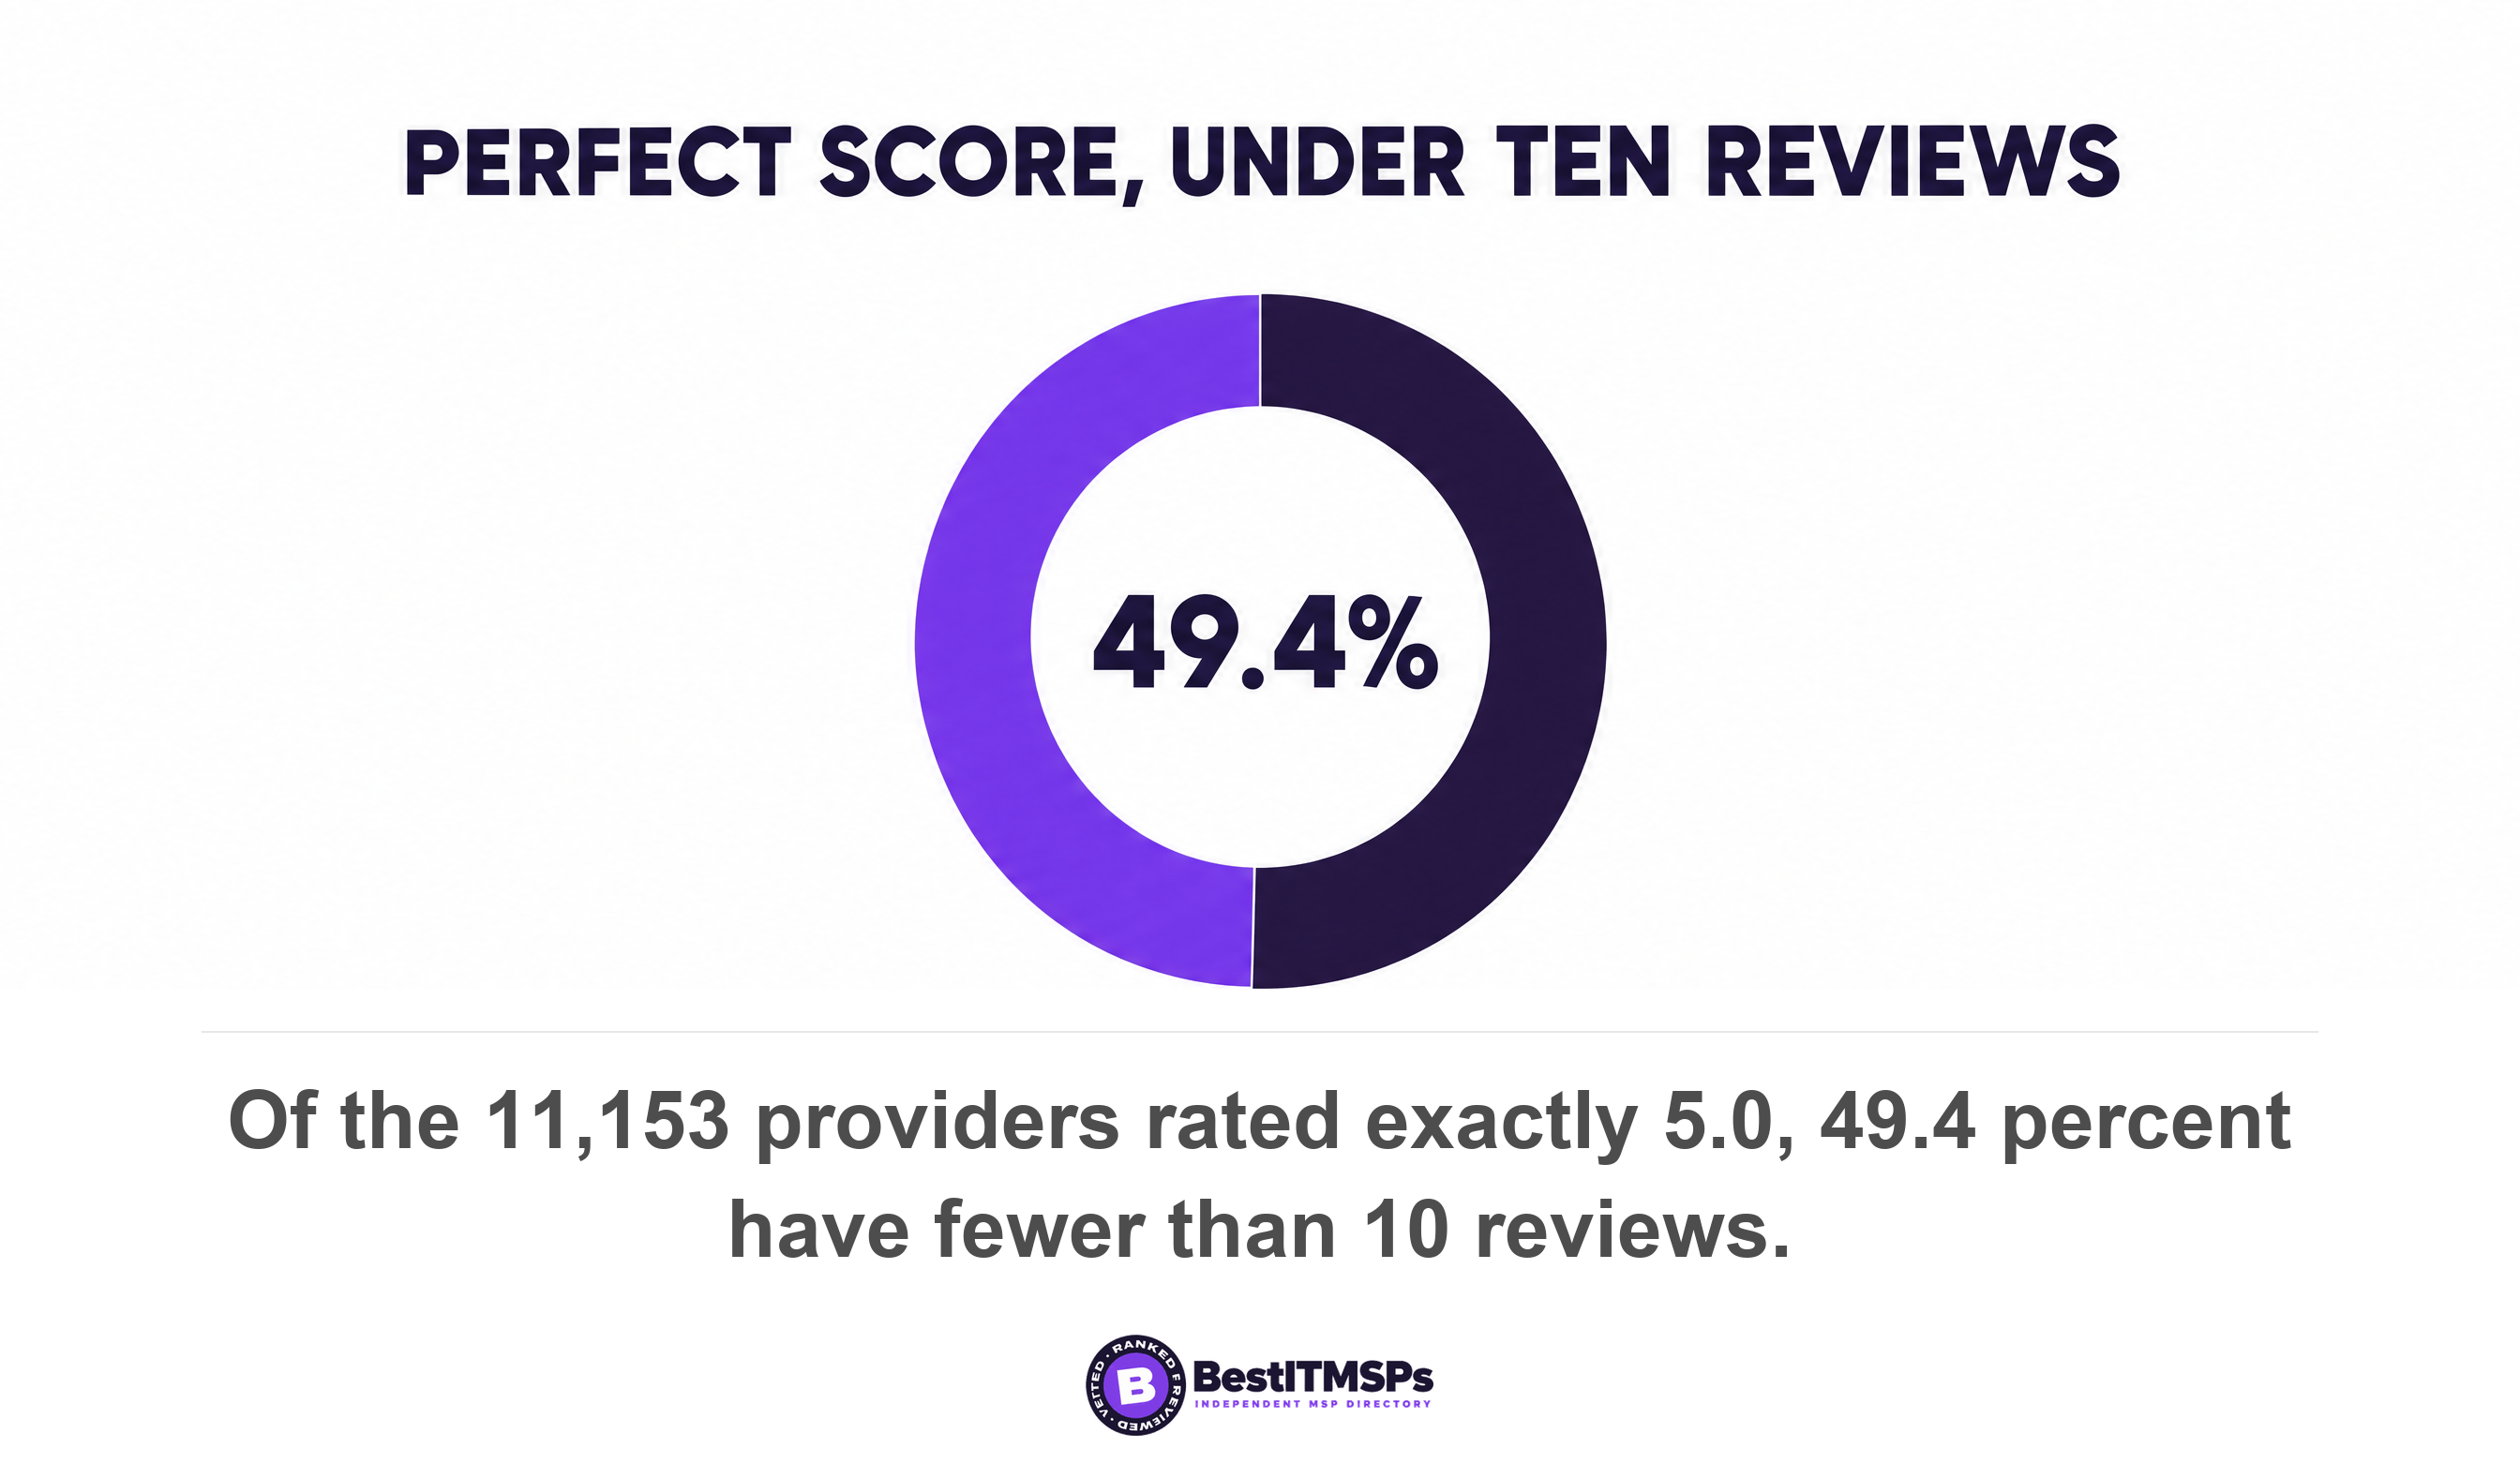
- Half the perfect scores are thin. Of the 11,153 firms rated 5.0, 49.4 percent have fewer than 10 reviews.
- Sorting a shortlist by stars mostly sorts by how few people reviewed each firm. A 4.7 from 50 reviews is a stronger signal than a 5.0 from 8.
- Google review data measures what reviewers wrote, not what a provider delivered. Use it to screen out, then verify with references and a signed SLA.
What 24,491 provider records say about MSP star ratings
A five-star rating is the most common rating in the managed IT market, not a mark of distinction. Across 24,491 provider records in 730 city datasets, 61.8 percent of rated providers sit at exactly 5.0.
The perfect scores also run with fewer reviews, not more. Firms rated exactly 5.0 carry a median of 10 reviews. Firms rated 4.5 to 4.99 carry a median of 28. Of the 11,153 firms rated 5.0, 49.4 percent hold fewer than 10 reviews. So a 4.7 from 50 reviews is a stronger signal than a 5.0 from 8. Sort a shortlist by star rating and you mostly sort by how few people reviewed each firm.
The rating is the first filter most buyers apply, and it is the weakest one they own. The decision behind it is expensive, because your provider holds administrator access to your systems and IBM puts the global average cost of a data breach at $4.99 million. Below you get the full rating distribution, the review volume behind it, our counting method, and the five checks that replace a star average.
61.8 percent of rated providers sit at exactly 5.0
The rating distribution is too top-heavy to separate providers. Of the 18,059 rows that carry both a rating and a review count, the six bands break down as listed below.
- Exactly 5.0. 11,153 firms, 61.8 percent.
- 4.9 to 4.99. 2,262 firms, 12.5 percent.
- 4.5 to 4.89. 2,929 firms, 16.2 percent.
- 4.0 to 4.49. 1,072 firms, 5.9 percent.
- 3.0 to 3.99. 498 firms, 2.8 percent.
- Below 3.0. 145 firms, 0.8 percent.
Two summary numbers make the same point. The mean rating is 4.821 and the median is exactly 5.00. A quarter of rated providers sit at 4.80 or below, and the bottom tenth at 4.50 or below. At the bottom, 2.8 percent score between 3.0 and 3.99 and 0.8 percent score below 3.0. A signal that 61.8 percent of a market shares cannot rank that market, which is why we never rank on rating alone.
A perfect rating comes with fewer reviews, not more
The 5.0 group holds the thinnest review history of any top band. Review volume behind the three top bands is listed below.
- Rated exactly 5.0. 11,153 firms, median 10 reviews, mean 25.2.
- Rated 4.5 to 4.99. 5,199 firms, median 28 reviews, mean 48.3.
- Rated 4.0 to 4.49. 1,072 firms, median 9 reviews, mean 16.6.
Read the middle line again. Firms with a near-perfect but imperfect rating carry a median of 28 reviews against 10 for the perfect scorers, and a mean of 48.3 against 25.2. Review volume peaks in the middle of the rating scale and thins at both ends.
The cause is arithmetic, not integrity. A 5.0 survives only while no client has ever left a 4. One honest four-star review takes a firm with eight reviews to about 4.9, and barely moves a firm with eighty. The longer a provider collects reviews, the less likely a perfect average survives. Half the firms rated 5.0 hold fewer than 10 reviews, so half the perfect scores rest on a sample one bad week would erase. Weight every rating by the reviews behind it.
Independent research points the same way. The Medill Spiegel Research Center at Northwestern analyzed more than 40 categories and found purchase likelihood peaks between 4.2 and 4.5 stars, then drops as the rating approaches a perfect 5. The same research found five reviews lifted purchase likelihood 270 percent against none, with the benefit shrinking after the first five.
A 4.7 from 50 reviews has survived a bad month. A 5.0 from 8 has not been tested yet.
Why the perfect scores cluster at low review counts
Four forces push a thin-review firm toward 5.0, and none of them is evidence of better service.
- Selection bias. Google reviews are volunteered, not sampled. A happy client who gets asked writes one, and the quiet majority never does. Selection bias tilts every rating distribution upward.
- Sample size. A small sample size swings hard. Ten reviews cannot tell a good provider from a lucky one, because one unhappy client moves the average by a tenth of a star.
- Solicitation. Providers that solicit reviews at the right moment collect fives. Asking is allowed and paying is not. Google's policy states a review must reflect a genuine experience, and incentivized or biased reviews are removed, and the FTC's 2024 rule bans buying or selling fake reviews.
- Manipulation targets thin profiles. Luca and Zervas found about 16 percent of Yelp restaurant reviews were filtered as suspicious, with filtered reviews skewing to the extremes and weak-reputation firms, meaning those with few or poor reviews, most likely to post fake positives.
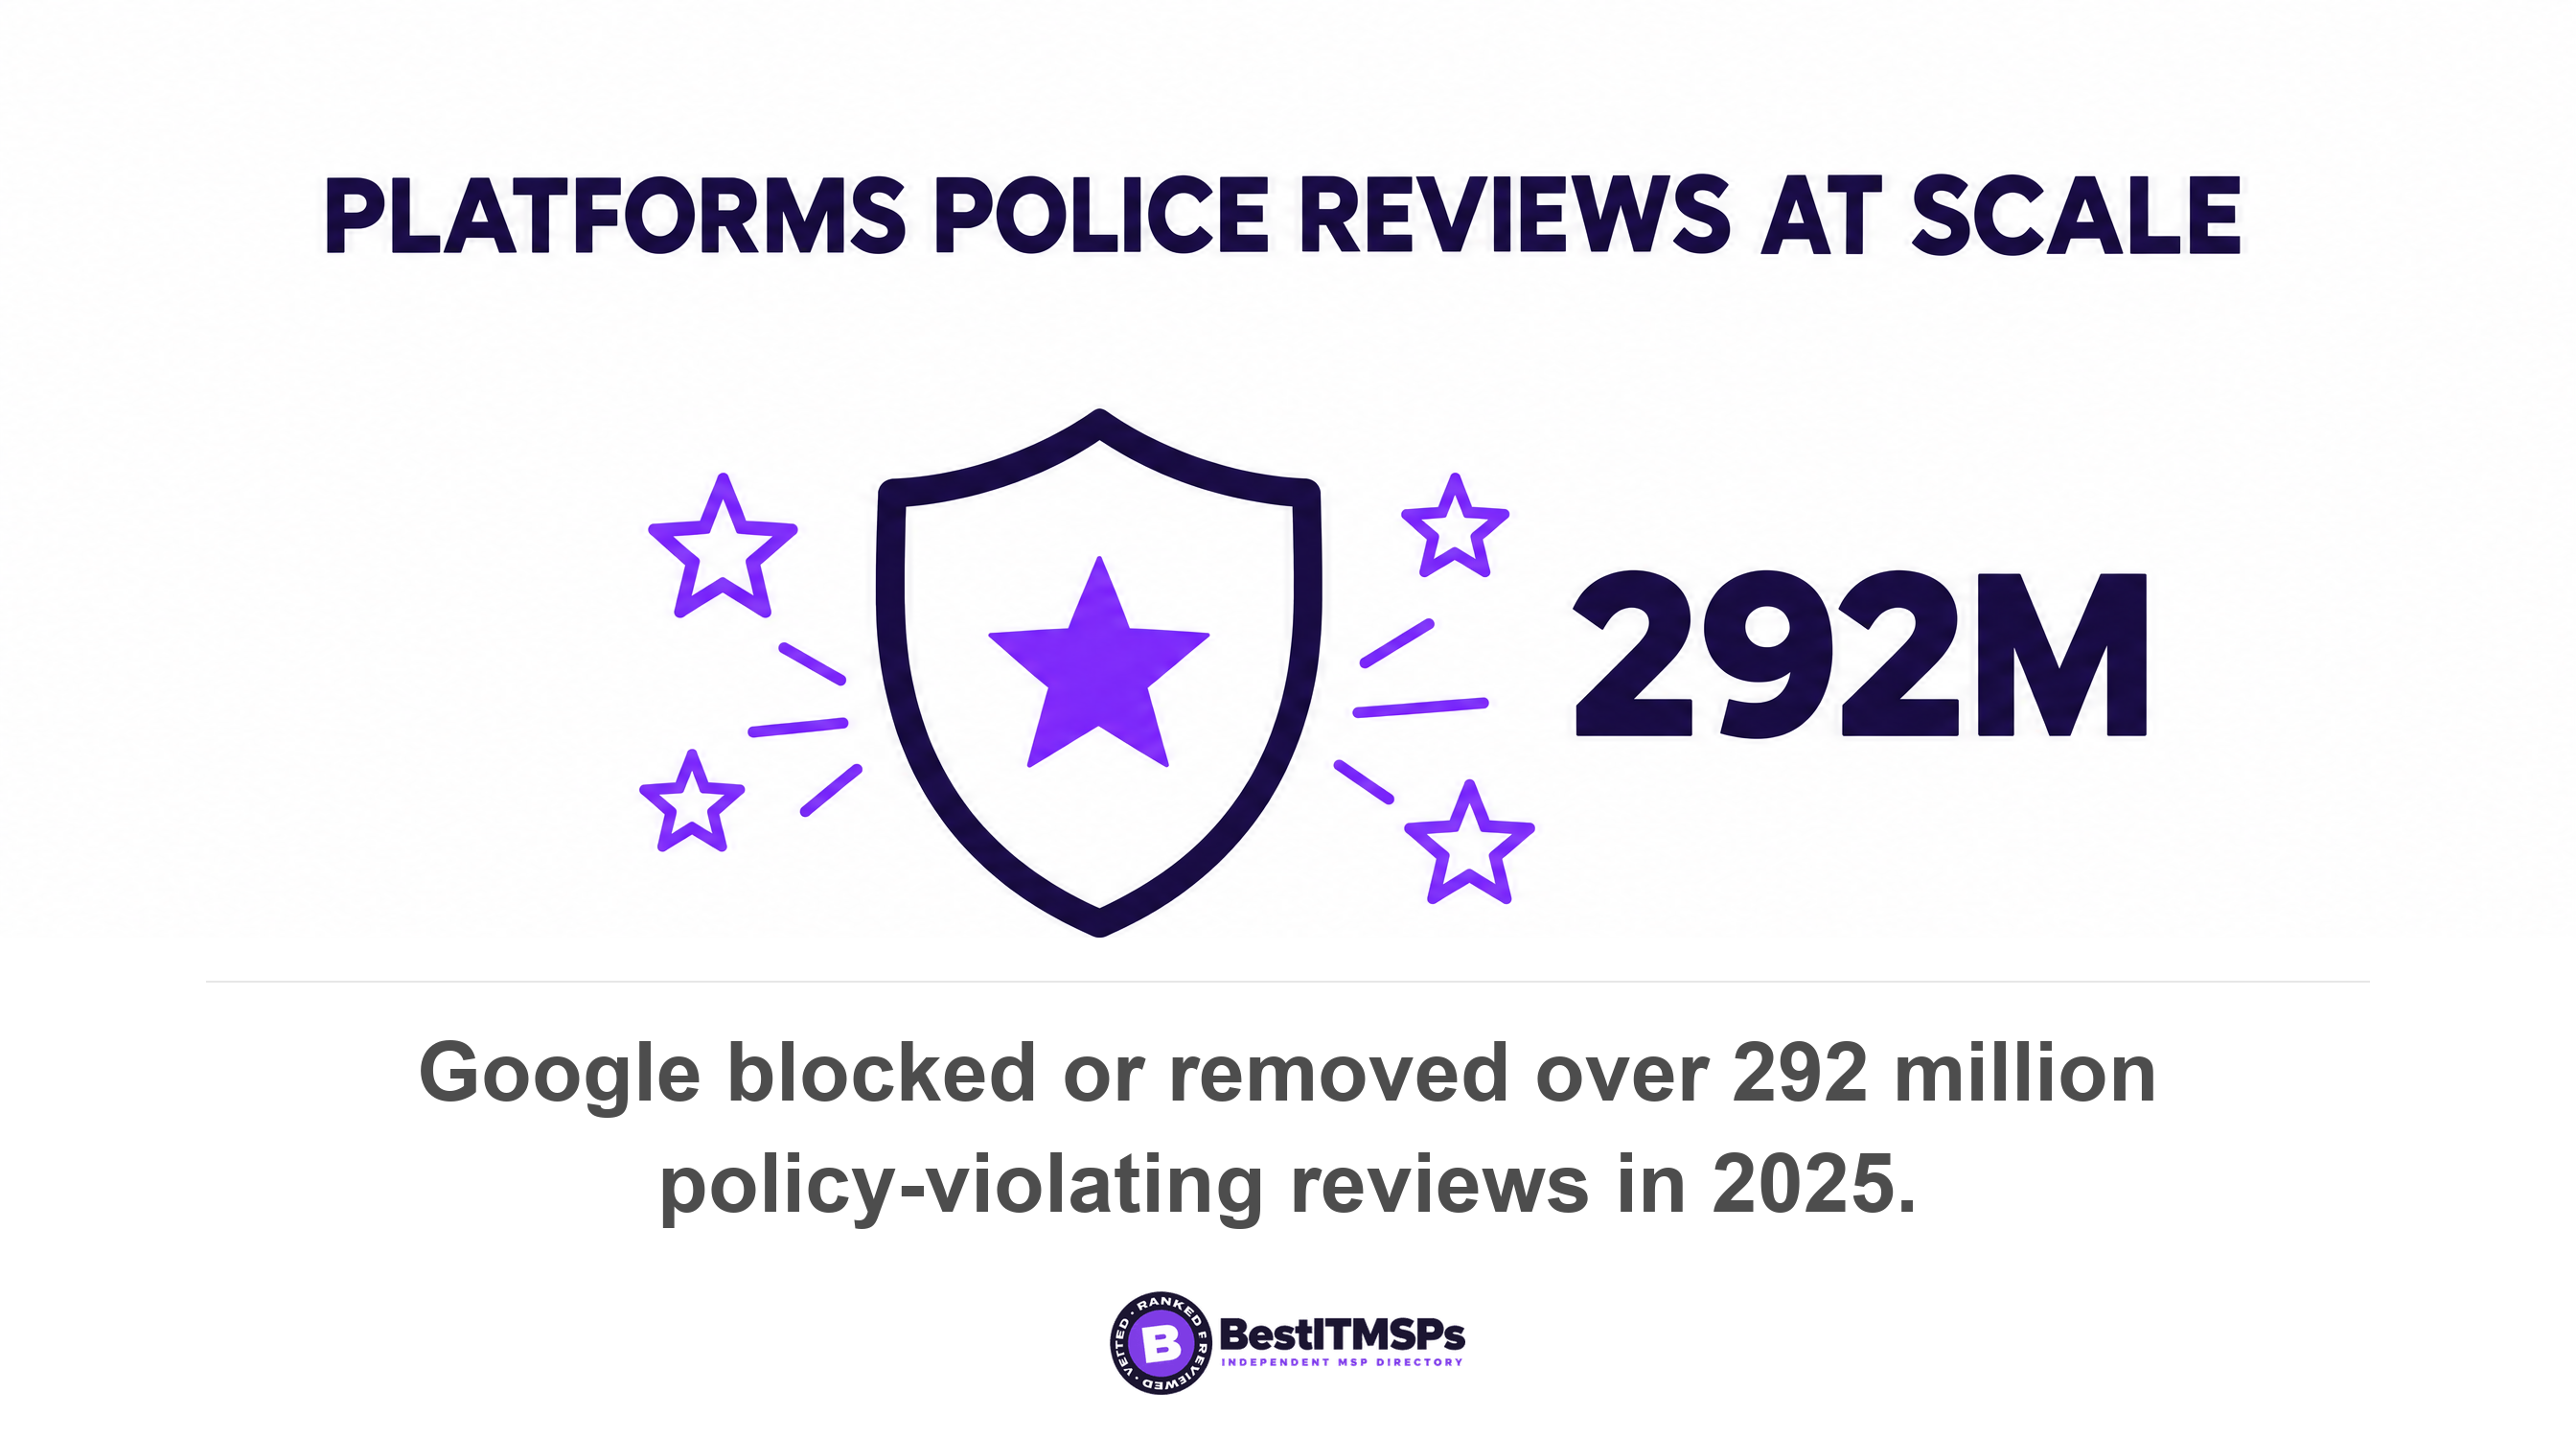
Enforcement runs at industrial scale. Google blocked or removed over 292 million policy-violating reviews in 2025 and removed over 13 million fake Business Profiles, against more than 1 billion reviews its users contributed in the same year. None of that makes any particular 5.0 fake. It makes a 5.0 uninformative on its own.
Most providers have far fewer reviews than you expect
A review-count rule has to be set against the real market, and the real market runs thin. The median rated provider carries 14 reviews.
- Under 5 reviews. 4,203 firms, 23.3 percent.
- Under 10 reviews. 7,235 firms, 40.1 percent.
- Under 25 reviews. 11,985 firms, 66.3 percent.
- Under 50 reviews. 15,047 firms, 83.2 percent.
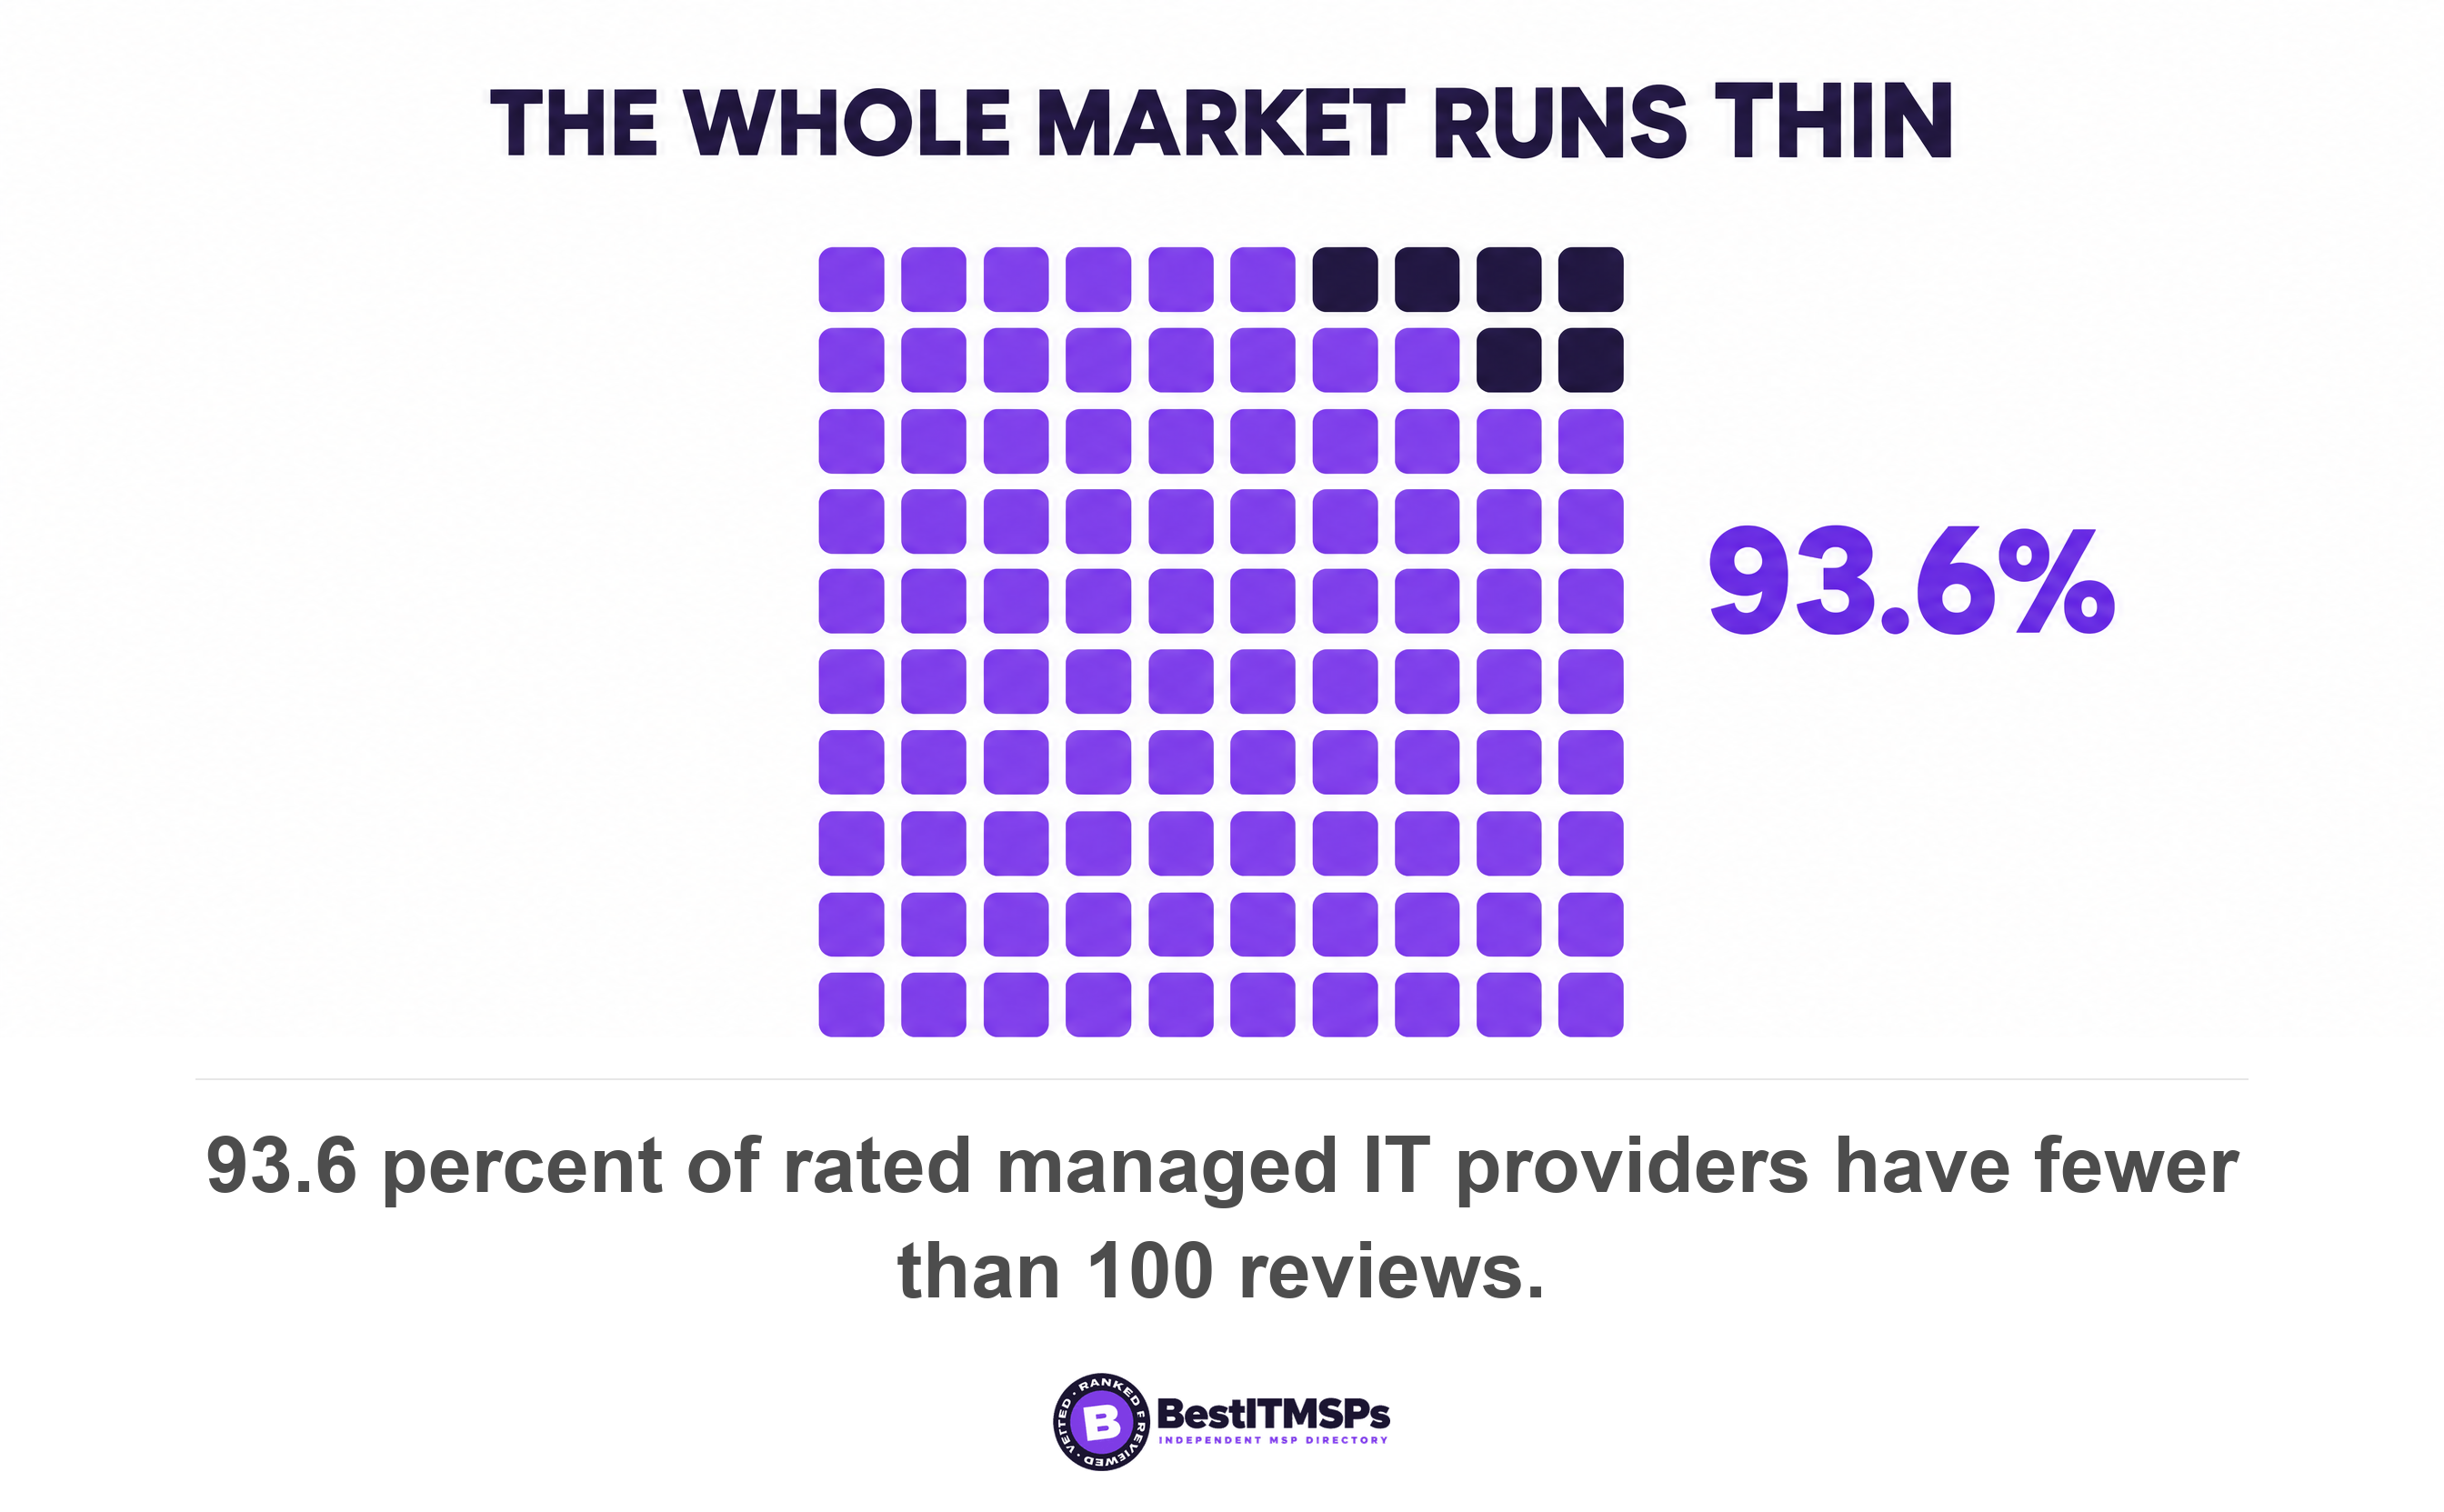
- Under 100 reviews. 16,896 firms, 93.6 percent.
The top tenth of providers by review volume start at 76 reviews, and the top 1 percent at 252. A rule such as only consider firms with 100 or more reviews excludes 93.6 percent of rated providers, including most strong small firms in a mid-sized metro. A workable rule reads differently. Treat anything under 10 reviews as unmeasured rather than excellent, then compare firms inside the same volume band.
The unrated rows deserve the same care. 6,432 rows, 26.3 percent of the roster, carry no rating at all. An unrated provider is not a bad provider. Some are new, some have never asked a client, and some serve sectors where nobody reviews anything in public. We excluded every one of them from the rating statistics rather than scoring them as zero.
One provider, many cities, and what that does to a rating
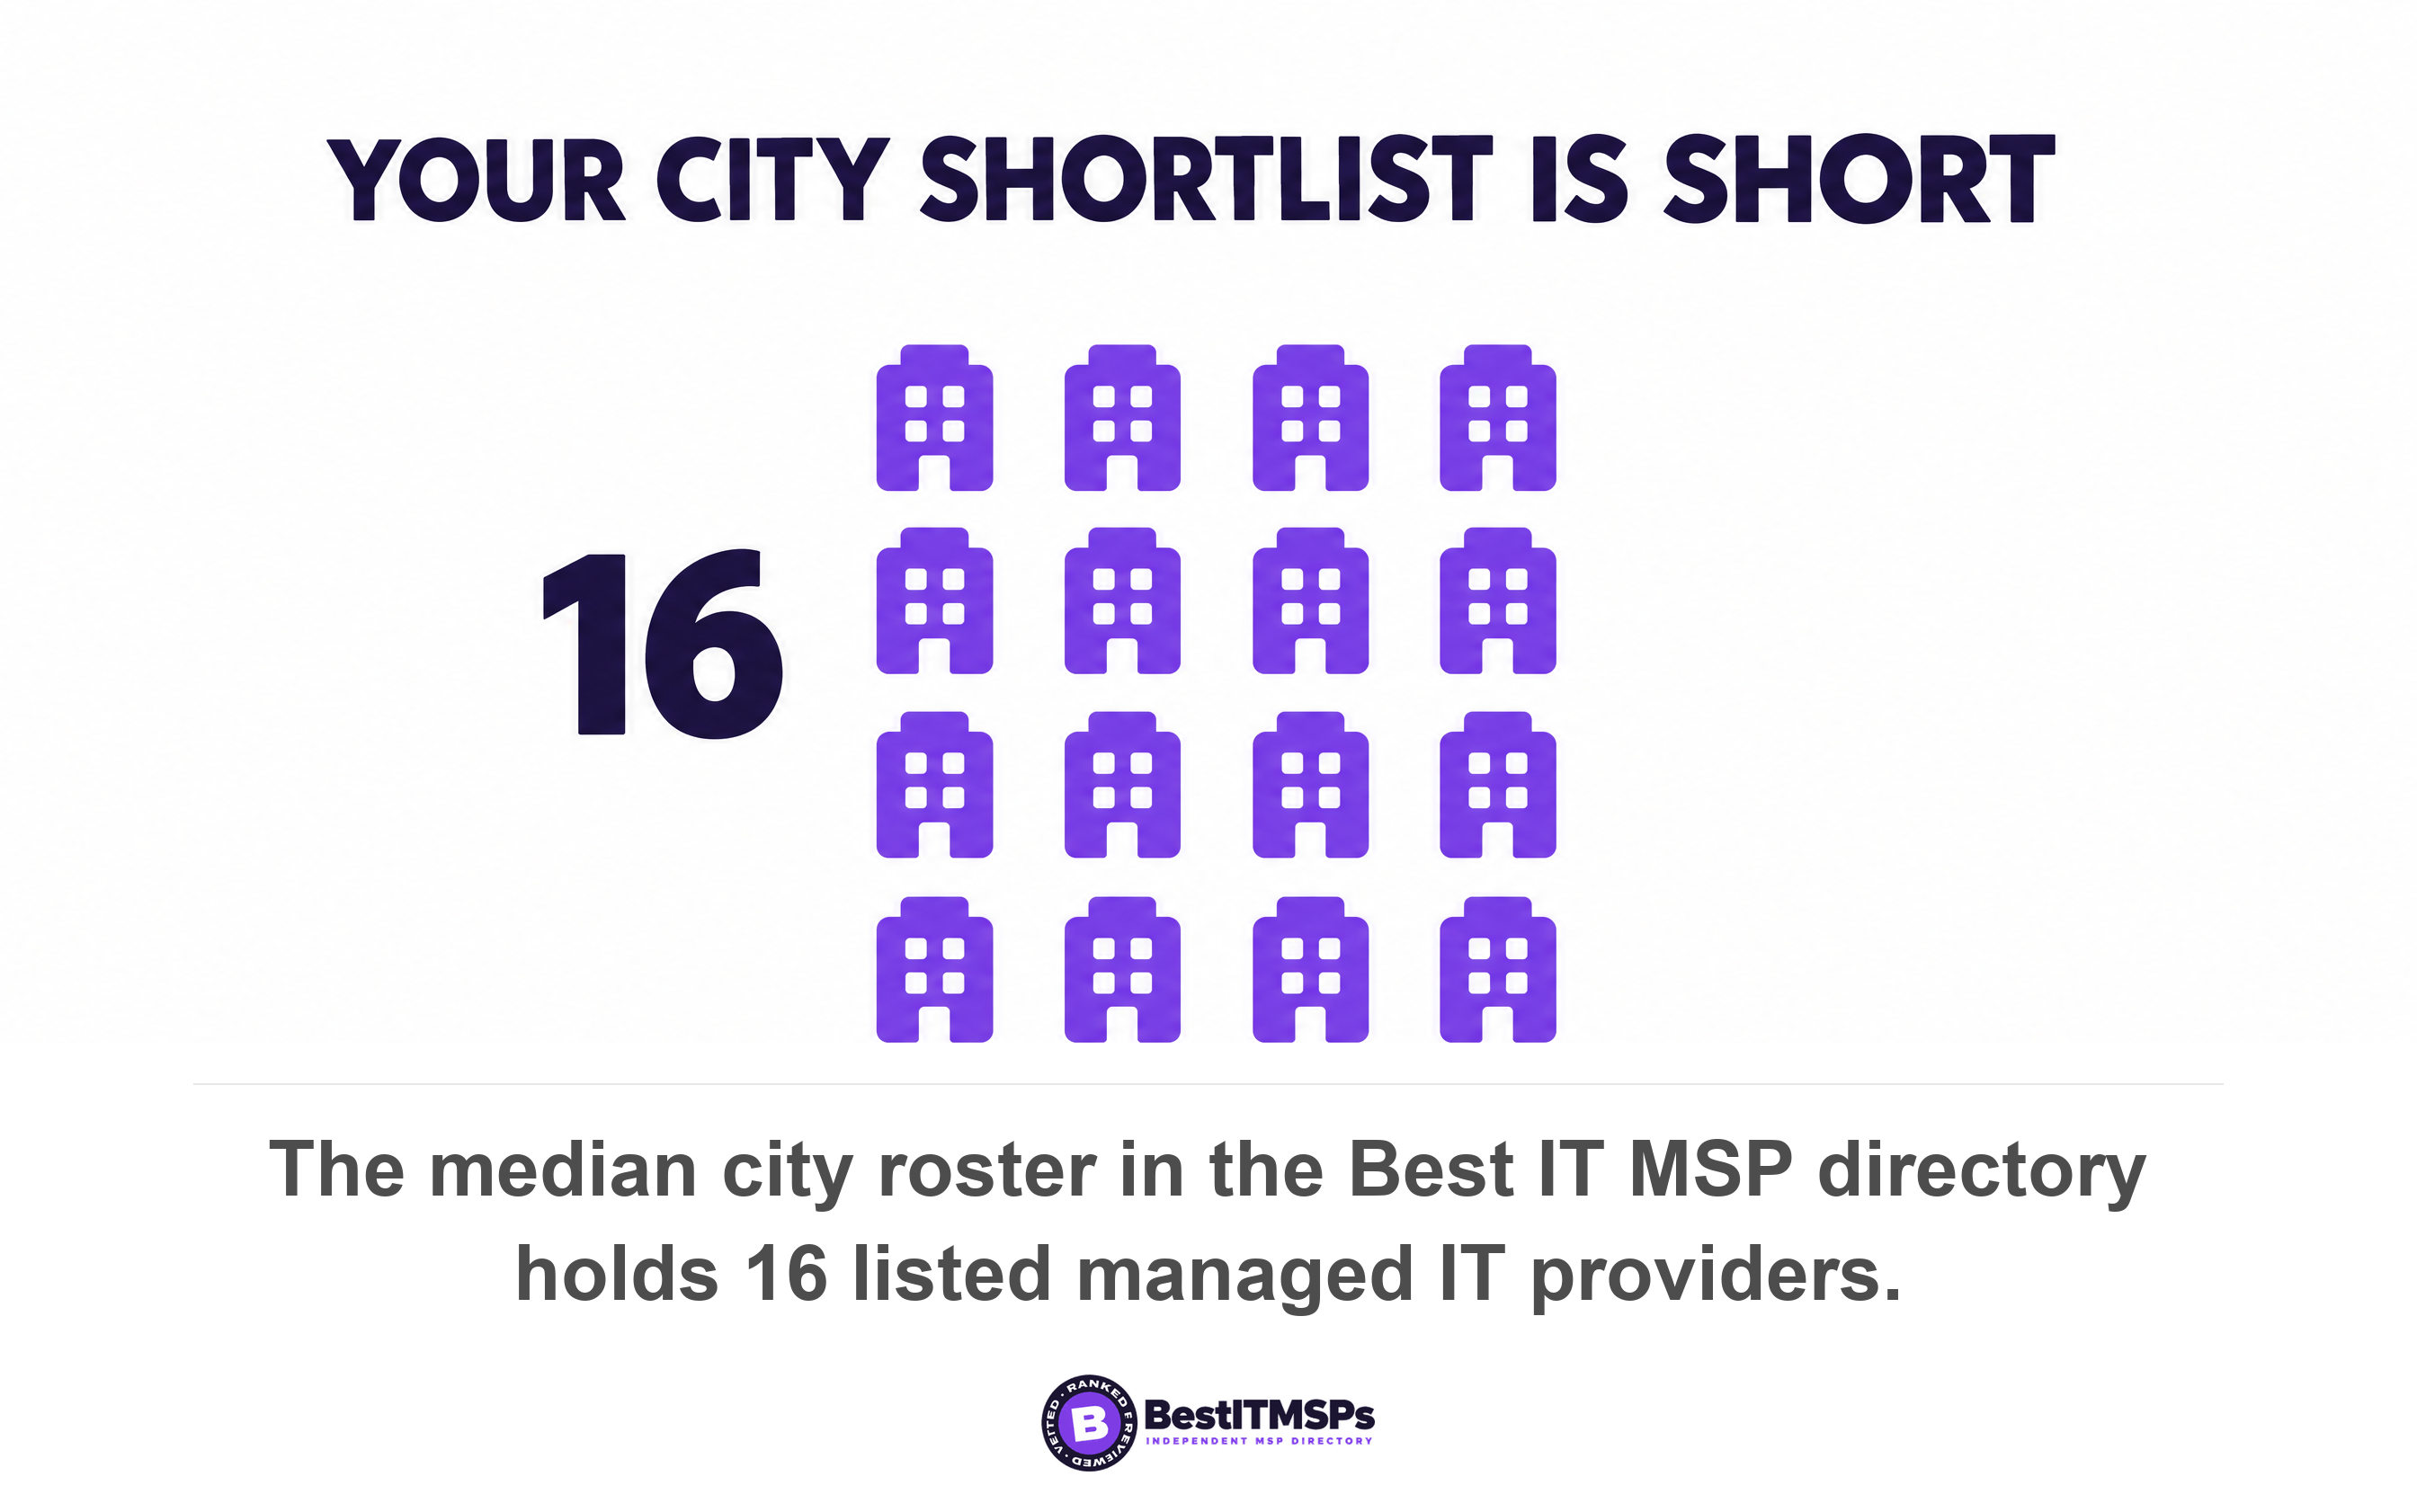
Provider density is lower than a search results page suggests, and the same brands repeat across metros. The median city roster holds 16 listed providers, with the thinnest tenth at 8 and the busiest tenth at 34.
Market concentration shows up in the domains. 2,611 domains, 21.8 percent of the 11,971 distinct domains in the dataset, appear in more than one city roster. The largest multi-market domains are cmitsolutions.com at 131 rows, teamlogicit.com at 73, itsasap.com at 42, gocorptech.com at 36 and itsolutions-inc.com at 35.
That changes how you read a score. A multi-location provider collects reviews office by office, so one brand can hold a very different rating in two metros. Judge the local office that will answer your phone. In a thin market you also have fewer comparable quotes, which costs you leverage on price.
How we counted, and what this data cannot tell you
To produce these figures we analyzed every city dataset the directory publishes, on 20 October 2026, under four rules.
- Deduped the files by the city slug each one declares, keeping the richest file per slug, which left 730 distinct city datasets and 24,491 roster rows.
- Excluded unrated rows from every rating statistic instead of counting them as zero, which left 18,059 rows carrying both a rating and a review count.
- Counted a provider once per city roster it appears in, so a multi-location provider contributes several rows and 11,971 distinct domains sit behind the 24,491 rows.
- Reported medians beside means, because a long tail of high-volume firms drags a mean upward and hides the typical firm.
Four limits apply, and they are why this is a market map rather than a verdict on one firm.
- These are Google reviews. They measure what reviewers chose to write, not what a provider delivered.
- Nothing here measures outcomes. No ticket resolution time, no tested restore and no breach record sits inside a star average.
- A thin review history means little alone. A firm that started asking last quarter looks identical to a firm nobody rates.
- A rating is a snapshot. Each one was recorded when its city was researched, so a live score moves after we capture it.
Publishing the directory methodology is the point, because a number nobody can check is marketing. The wider standard we apply, covering the signals we weigh beyond rating, sits in our evaluation process. BrightLocal found 74 percent of consumers check two or more review sites before they decide, which is the right instinct. One platform is one sample.
How to read a provider's rating on Tuesday morning
To use a rating well, treat it as a screen rather than a ranking, then spend your time on the five checks below.
- Screen out, do not rank. Drop anything rated below 4.0, then stop sorting by stars.
- Check the review count before the score. Under 10 reviews is unmeasured, not excellent.
- Read the three newest reviews in full. The count gives you the sample size, and the text tells you what broke.
- Compare firms inside one volume band. A 4.7 from 50 reviews beats a 5.0 from 8 every time.
- Verify off the platform. Ask for a client reference at your size and in your sector, the service level agreement with its response and resolution targets, and the date of the last tested restore.
Then ask one question about the reviews themselves. Ask when the provider started asking clients for reviews, and who it asks. A transparent answer names a process and a date. A defensive answer tells you the rating was managed rather than earned. Our guide on how to choose a managed service provider and the questions to ask before hiring an IT provider carry the rest.
A star average is cheap, useful and noisy. It is good at telling you who to stop looking at and poor at telling you who to hire. We rank providers on verified rating plus firmographic data for that reason, we label paid placement, and we do not sell IT services. Use the rating to cut a long list to five, then shortlist three on evidence you can check yourself.
FAQ
Is a 5-star rating a good sign when choosing an MSP?
A 5.0 is the market default, not a mark of quality. In our dataset 61.8 percent of rated providers sit at exactly 5.0, and 49.4 percent of those firms have fewer than 10 reviews. Check the review count first, then compare firms with similar volume.
How many Google reviews should an IT provider have?
Ten is the floor for a rating to mean anything, and the market gives you little more. The median rated provider carries 14 reviews and 93.6 percent have fewer than 100. Demanding 100 reviews would exclude almost every provider in a mid-sized metro, including strong small firms.
Why do so many MSPs have a perfect 5.0 rating?
Thin samples and volunteered reviews. A 5.0 holds only until one client leaves a 4, so it survives longest on firms with few reviews. Half the 5.0 firms in our data have fewer than 10 reviews, and Google removes incentivized or biased reviews when it finds them.
Is a 4.7 rating better than a 5.0 rating?
Usually yes, if the 4.7 carries more reviews. Firms rated 4.5 to 4.99 hold a median of 28 reviews against 10 for firms rated exactly 5.0. Northwestern's Spiegel research found purchase likelihood peaks between 4.2 and 4.5 stars and falls as scores approach a perfect 5.
Can an IT provider buy or fake Google reviews?
It happens, and platforms remove it at scale. Google blocked or removed over 292 million policy-violating reviews in 2025. The FTC's 2024 rule bans buying or selling fake reviews. Research also finds manipulation concentrates on firms with few or poor reviews, which is the thin-profile group.
Best IT MSP is the independent directory of vetted managed IT providers across North America. Organic ranking is earned on verified rating and firmographic data, and paid placement is always labelled. Compare the shortlist for your city, then take the five checks above into every call.